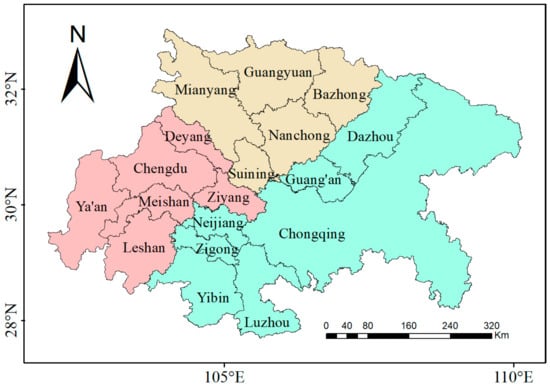
3.3.1. Correlation Analysis of O3 Concentration and UHII
As presented in
Table 3, the lagged correlation coefficients between O
3 concentration and UHII for each season range from 0.355 to 0.642 in Chengdu, 0.044 to 0.348 in Chongqing, and −0.014 to 0.181 in Nanchong, all of which pass the significance test at the two-sided 0.01 level. Despite the lag effect, a positive correlation between O
3 concentration and UHII is generally observed. Urban UHI alters the regional heat balance, accelerating local temperature changes and enhancing the activity of urban atmospheric photochemical reactions, which in turn increases O
3 concentration. Additionally, stored heat post-sunrise can maintain higher temperatures even as sunlight intensity decreases, causing a lag in peak O
3 concentration. Xin Li et al. reported a 1–2 h lag of O
3 concentration relative to temperature, supporting the observed lag correlation [
42]. Furthermore, He Jing et al. found that O
3 production and consumption are primarily controlled by local photochemical reactions and are closely related to precursor concentrations (NO, NO
2, NOx), alongside meteorological factors such as solar radiation [
57]. This also highlights the weak direct relationship between the UHII and O
3 concentrations. Dan Shang Ming et al. noted that water bodies can buffer urban UHI effects, contributing to the lower correlation between the UHII and O
3 in Chongqing and Nanchong due to the influence of the Jialing River [
58].
As illustrated in
Figure 11, the daily trends of O
3 and UHII in Chengdu and Chongqing across different seasons, as well as in Nanchong during winter, generally follow a “single peak and single valley” pattern. However, in Nanchong, the UHII pattern in other seasons shows “multiple peaks and multiple valleys.” There is a notable lag between the peak UHII and O
3 concentrations (
Table 3). In Chengdu, the peak O
3 concentration lags 9 h behind peak UHII, while in Chongqing and Nanchong, the lag varies seasonally: in Chongqing, the peak O
3 concentration lags 8 h in spring, 6 h in summer, and 7 h in autumn and winter; in Nanchong, the lag is 1 h in spring and autumn and 5 h in summer. This lag is influenced by the diurnal variations in solar radiation and the dynamics of O
3 production and consumption.
3.3.2. Effect of UHI on the Spatial Distribution Characteristics of O3 Pollution
As shown in
Figure 12 and
Figure 13, the spatial distribution differences of O
3 across various UHII levels are illustrated. Under the influence of a very strong heat island effect, O
3 concentration and UHII are relatively high in the main urban areas of Chengdu (Jinniu District and Chenghua District) and the northern parts of these districts, as well as in Chongqing’s Hechuan District, Changshou District, and Fengdu County. Conversely, O
3 concentration and UHII are lower in areas like Dujiangyan City and Chongzhou City in western Chengdu, and Wuhou District, southern Jinjiang District, and northern Shuangliu District in Chengdu, and Banan District and Nanan District in Chongqing.
Under a strong heat island effect, most of Chengdu’s main urban areas (Jinniu and Qingyang Districts) have high UHII and O3 concentrations. However, Chenghua District, Jinjiang District, and the eastern areas and main urban areas of Chongqing have high UHII but relatively low O3 concentrations. Dujiangyan City and Chongzhou City in western Chengdu exhibit relatively high O3 concentrations but low UHII. Other areas in Chongqing, excluding the main urban area, show average O3 concentrations with no distinct high-value areas, while places like Zhongxian in the central city have high UHII but are not extreme O3 concentration areas.
Under a medium heat island effect, central areas like the main city of Chengdu and Zhongxian County in Chongqing still have high UHII values, but O3 concentration is not very strong. Western areas such as Dujiangyan City in Chengdu, northern areas such as Wuxi County and Chengkou County in Chongqing, and Jialing District in Nanchong show high O3 concentrations but relatively low UHII. Southwestern areas like Bishan District and Banan District in Chongqing and the junction of Jialing District and Gaoping District in Nanchong have low O3 concentrations and relatively high UHII. Additionally, northern regions like Langzhong City and Yilong County also have relatively low O3 and UHII values, with no obvious extreme values appearing.
Under a weak heat island effect, main urban areas such as Jinniu District and Chenghua District in Chengdu, Kaizhou District and Yunyang County in Chongqing, and Pengan County in Nanchong show relatively high O3 concentrations and correspondingly high UHII. Areas like Dujiangyan City and Chongzhou City in western Chengdu, Fengdu County in Chongqing, and Yilong County and Yingshan County in Nanchong have low O3 concentrations and correspondingly low UHII. Areas like southern Wuhou District and Jinjiang District in Chengdu, southeastern Qianjiang District in Chongqing, and northern Langzhong City and Nanan County in Nanchong have low O3 concentrations but relatively high UHII. Furthermore, Jinyang City, Jintang County, and Gaoxin East District in Chengdu exhibit high UHII values, while O3 concentrations do not show significant variations.
Under no heat island effect, areas such as Pujiang County, Jinyang City, Gaoxin East District, and southeastern Pengzhou City in Chengdu, Liangping District, Zhong County, and Wanzhou City in Chongqing, and Shunqing District and Gaoping District on the south side of Nanchong show high UHII values but relatively low O3 concentrations. Conversely, areas like Dujiangyan City in Chengdu, the main city of Chongqing, and the northwest side of Langzhong City and Nanan County in Nanchong, have high O3 concentrations but low UHII values.
As the UHII level decreases, UHII in central and eastern Chengdu also decreases, with the high UHII area moving eastward and the low O3 concentration area gradually shifting from the southeast to the northwest. The south side of the main urban area, such as Jinjiang District and Gaoxin South District, remains a low O3 concentration area, while high O3 concentration areas and low UHII areas remain relatively unchanged, primarily located in the northwest side of Dujiangyan City. In Chongqing, high O3 concentration areas gradually move northward, while low O3 concentration areas in Shapingba and extreme UHII areas show minimal change as the heat island level decreases. Overall, O3 concentration first increases and then gradually decreases, peaking under medium heat island intensity, with minimal changes under very strong and strong heat island levels. The southeastern area, including Qianjiang District, and UHII values in Chengkou County and Wuxi County, show a trend of first weakening and then strengthening. In Nanchong, high O3 concentration areas keep moving from southeast to northwest, while low O3 concentration areas at the intersection of Shunqing District, Gaoping District, and Jialing District with extreme UHII areas show little change. As the heat island level decreases, high UHII areas in Nanchong gradually decrease, while low UHII areas gradually increase.
Based on the findings, it is evident that regions with high O
3 concentrations generally exhibit higher UHI intensity (UHII), while regions with low O
3 concentrations show correspondingly lower UHII. This observation supports the positive correlation between UHII and O
3 concentrations. The urban heat island effect alters the regional heat balance, accelerating local temperature changes and enhancing urban atmospheric photochemical reactions, thereby increasing O
3 concentrations [
59]. However, discrepancies in the correlation between O
3 and UHII in some regions suggest that UHI can influence the spatial distribution of O
3 concentrations to some extent.
To verify the hypothesis that UHI affects O
3 distribution, we analyzed NO
2 concentrations, a critical O
3 precursor, under the influence of different UHI classes. The results, shown in
Figure 14 and
Figure 15, indicate that high NO
2 concentration areas are mainly concentrated in Wuhou District, Chenghua District, and the eastern side of Chengdu; Beibei District, Yubei District, Fengdu County, and Shizhu Tujia Autonomous County in Chongqing; and the northeast side of Yingshan County in Nanchong City. Low NO
2 concentration areas are located in the northwest side of Dujiangyan City and the southwest side of Jialing District in Nanchong City. Additionally, NO
2 concentrations in Chongqing first increase and then decrease as the UHI intensity decreases, while in Nanchong, NO
2 concentrations gradually increase from southwest to northeast. The spatial distribution of NO
2 in Chengdu, Chongqing, and Nanchong does not significantly change with the UHI class, whereas O
3 distributions vary with different UHI classes. This indicates that UHI can affect O
3 distribution to some extent.
The analysis of wind fields can help explain this phenomenon.
Figure 14 shows that as the UHII levels decrease, the wind direction in Chengdu and its eastern area shifts from southeast to northeast, which favors the dilution and diffusion of O
3 in the east, causing the low O
3 concentration area to gradually move from southeast to northwest. Conversely, in northwest Chengdu (e.g., Dujiangyan), lower wind speeds result in weaker O
3 dilution and diffusion, leading to relatively higher concentrations. Under very strong UHI conditions, southeast winds on the east side and southwest winds on the west side of Chengdu converge in the main urban area, making it a high O
3 concentration area. In Chongqing, as UHII decreases, wind speed first decreases and then increases, corresponding to the observed trend of increasing and then decreasing O
3 concentrations. Low wind speeds hinder O
3 dilution and diffusion, leading to higher O
3 concentrations at lower UHI levels. As the UHI grade decreases, the wind direction shifts from southerly to northerly, causing high O
3 concentration areas to move northward. In Nanchong, the wind direction remains predominantly northerly, regardless of the UHI class. However, wind speed decreases with decreasing UHI levels, reducing O
3 dilution and diffusion, resulting in higher O
3 concentrations under no heat island and weak heat island conditions compared to medium heat island levels. High O
3 concentration areas tend to move from southeast to northwest as the UHI levels decrease. Additionally, northwest regions, such as Langzhong City, experience O
3 transport from Guangyuan City, leading to higher O
3 concentrations compared to other areas.
In summary, the relationship between UHI and O3 is not simply linear. UHI affects O3 concentration in two main ways: first, by altering the local heat balance to promote O3 generation and second, by forming local wind patterns that influence the diffusion or accumulation of O3, resulting in distinct O3 concentration zones.