
Author Contributions
Conceptualization, Y.M. and Y.Z.; methodology, Y.M., Y.Z. and G.L.; software, Y.M.; validation, Y.M. and Y.Z.; formal analysis, Y.M.; investigation, Y.M.; resources, Y.M., Y.Z. and C.X.; data curation, Y.M.; writing—original draft preparation, Y.M.; writing—review and editing, Y.Z.; visualization, Y.M.; supervision, Y.Z.; project administration, C.X., J.X. and T.W.; funding acquisition, Y.Z. All authors have read and agreed to the published version of the manuscript.
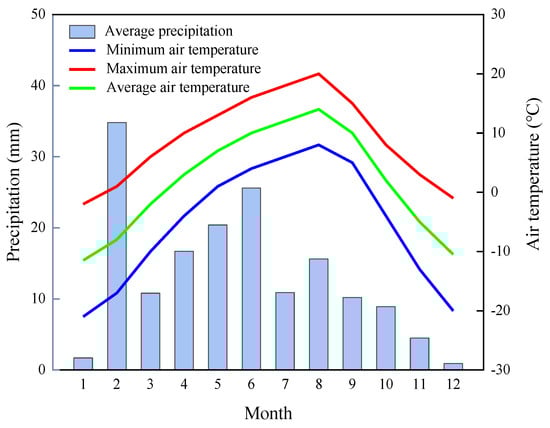
Temperature and precipitation in Haiyan County, Qinghai Province in 2023.
Figure 1.
Temperature and precipitation in Haiyan County, Qinghai Province in 2023.
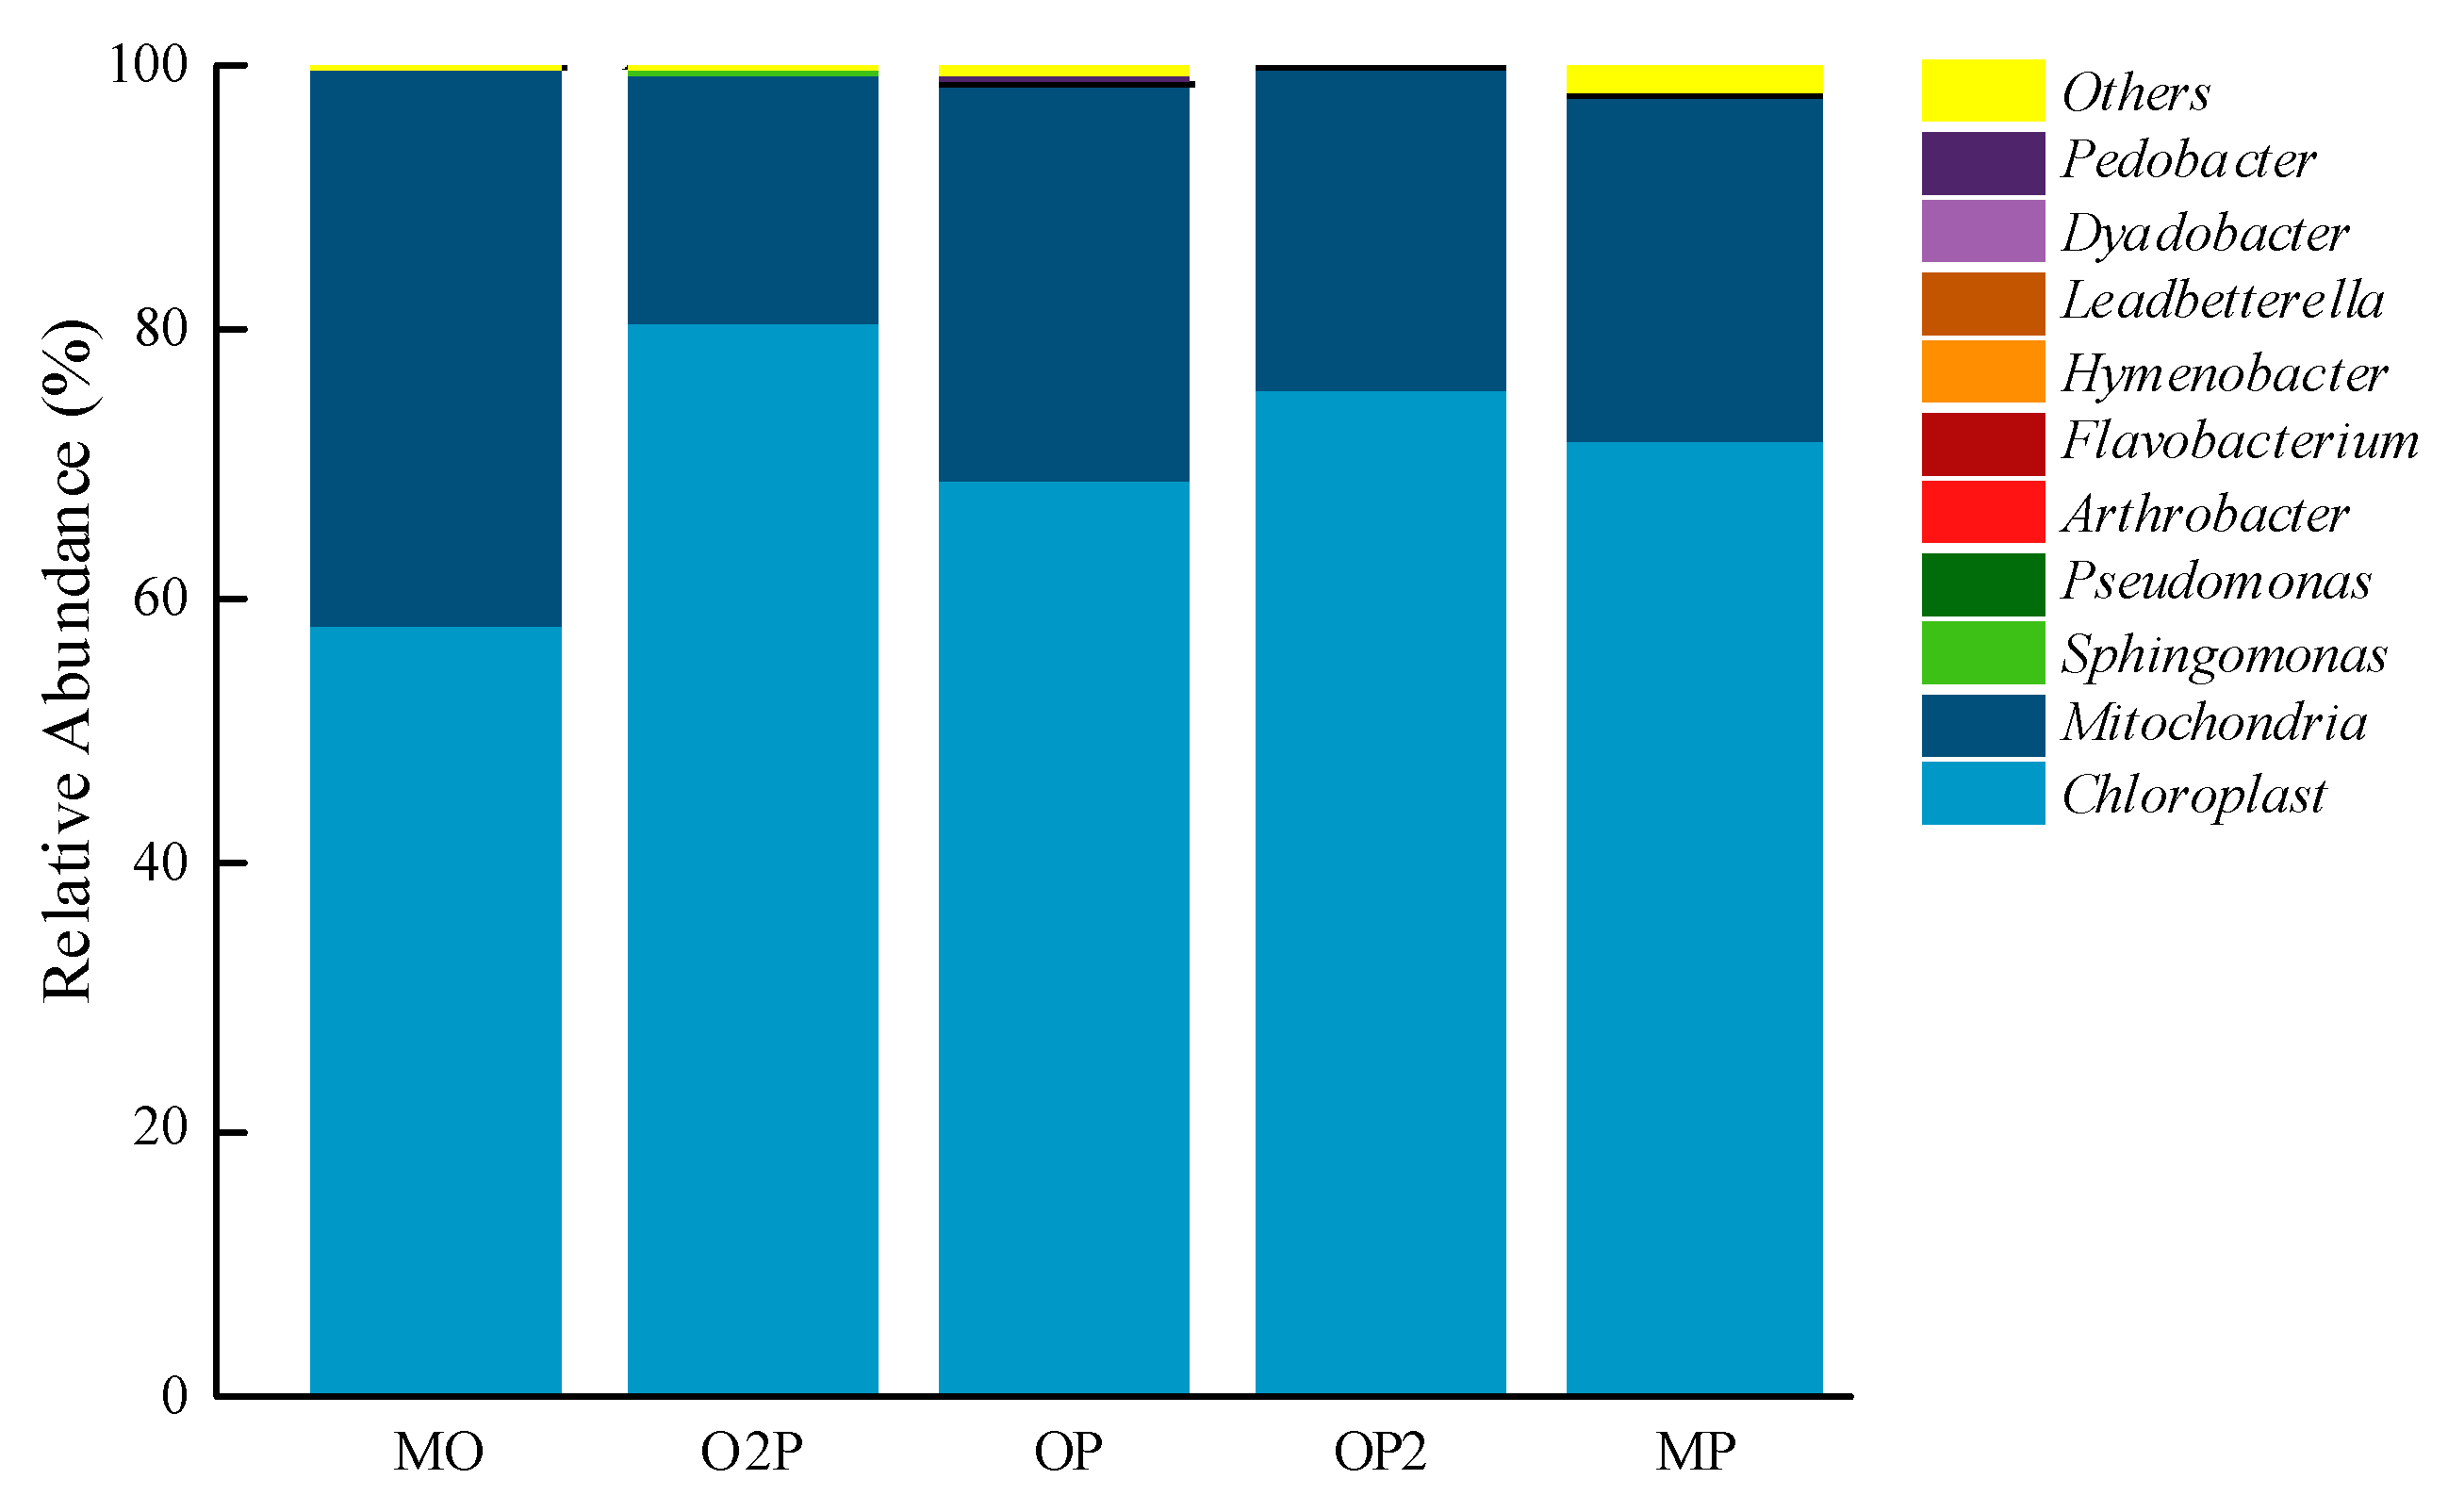
Relative abundance of microbial communities in silage raw materials.
Figure 2.
Relative abundance of microbial communities in silage raw materials.
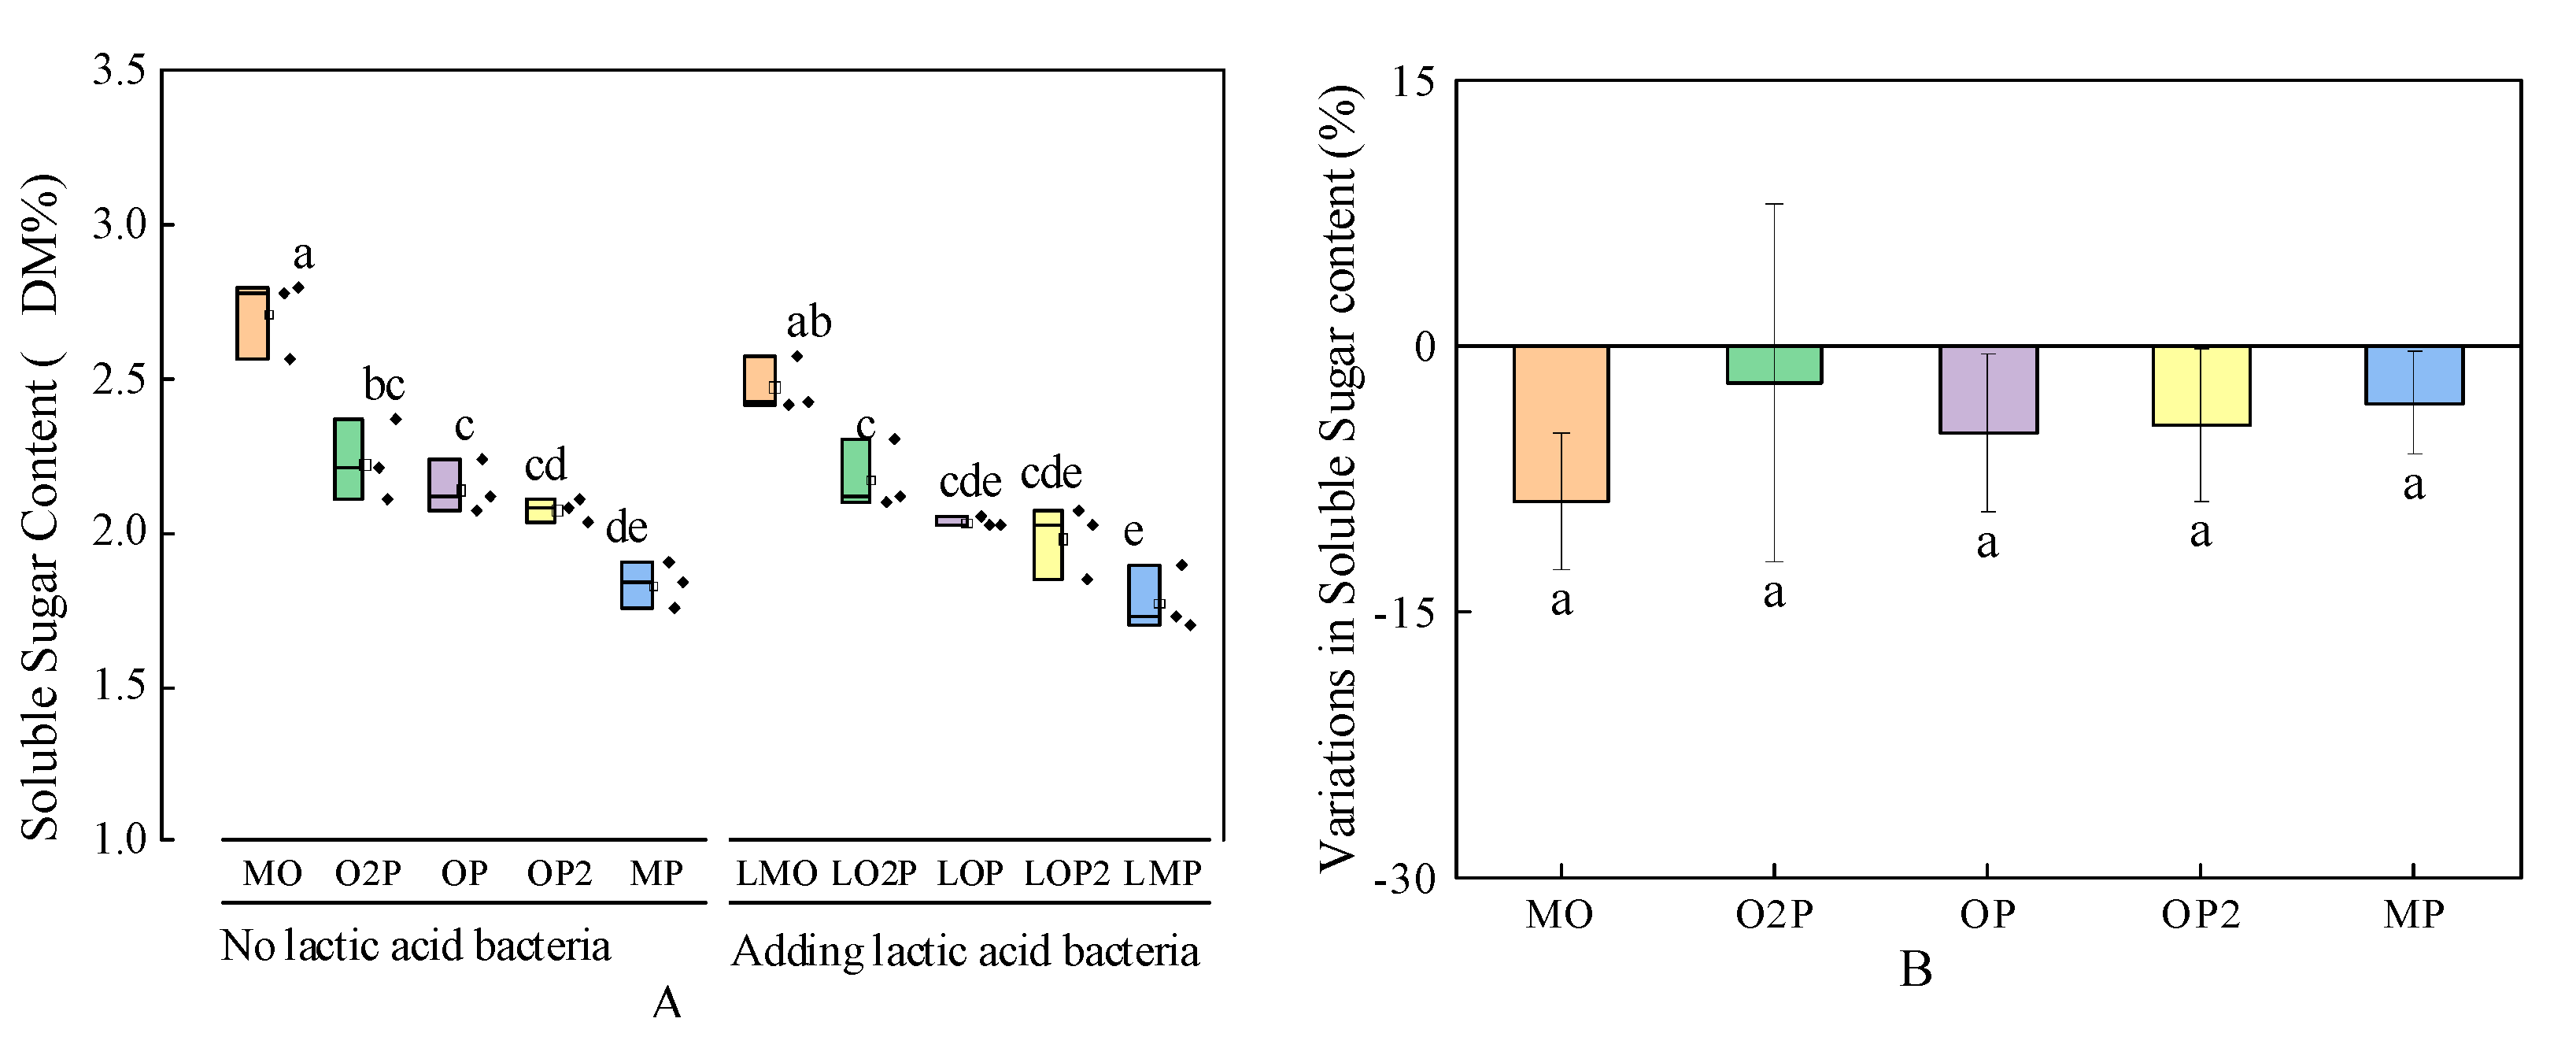
Effect of different mixed cropping ratios of oats and peas and lactic acid bacteria (LAB) additives on the soluble sugar (SS) content of silage (A) and variations in SS content for that with added LAB compared to that without added LAB at the end of the fermentation (B). Mean values in columns marked with the same letters do not differ significantly (p < 0.05). MO, O2P, OP, OP2, and MP represent oat–pea mixed cropping ratios of 1:0, 2:1, 1:1, 1:2, and 0:1, and the series is the silage treatment without lactic acid bacteria; the L series is the silage treatment with the addition of lactic acid bacteria (same as below).
Figure 3.
Effect of different mixed cropping ratios of oats and peas and lactic acid bacteria (LAB) additives on the soluble sugar (SS) content of silage (A) and variations in SS content for that with added LAB compared to that without added LAB at the end of the fermentation (B). Mean values in columns marked with the same letters do not differ significantly (p < 0.05). MO, O2P, OP, OP2, and MP represent oat–pea mixed cropping ratios of 1:0, 2:1, 1:1, 1:2, and 0:1, and the series is the silage treatment without lactic acid bacteria; the L series is the silage treatment with the addition of lactic acid bacteria (same as below).
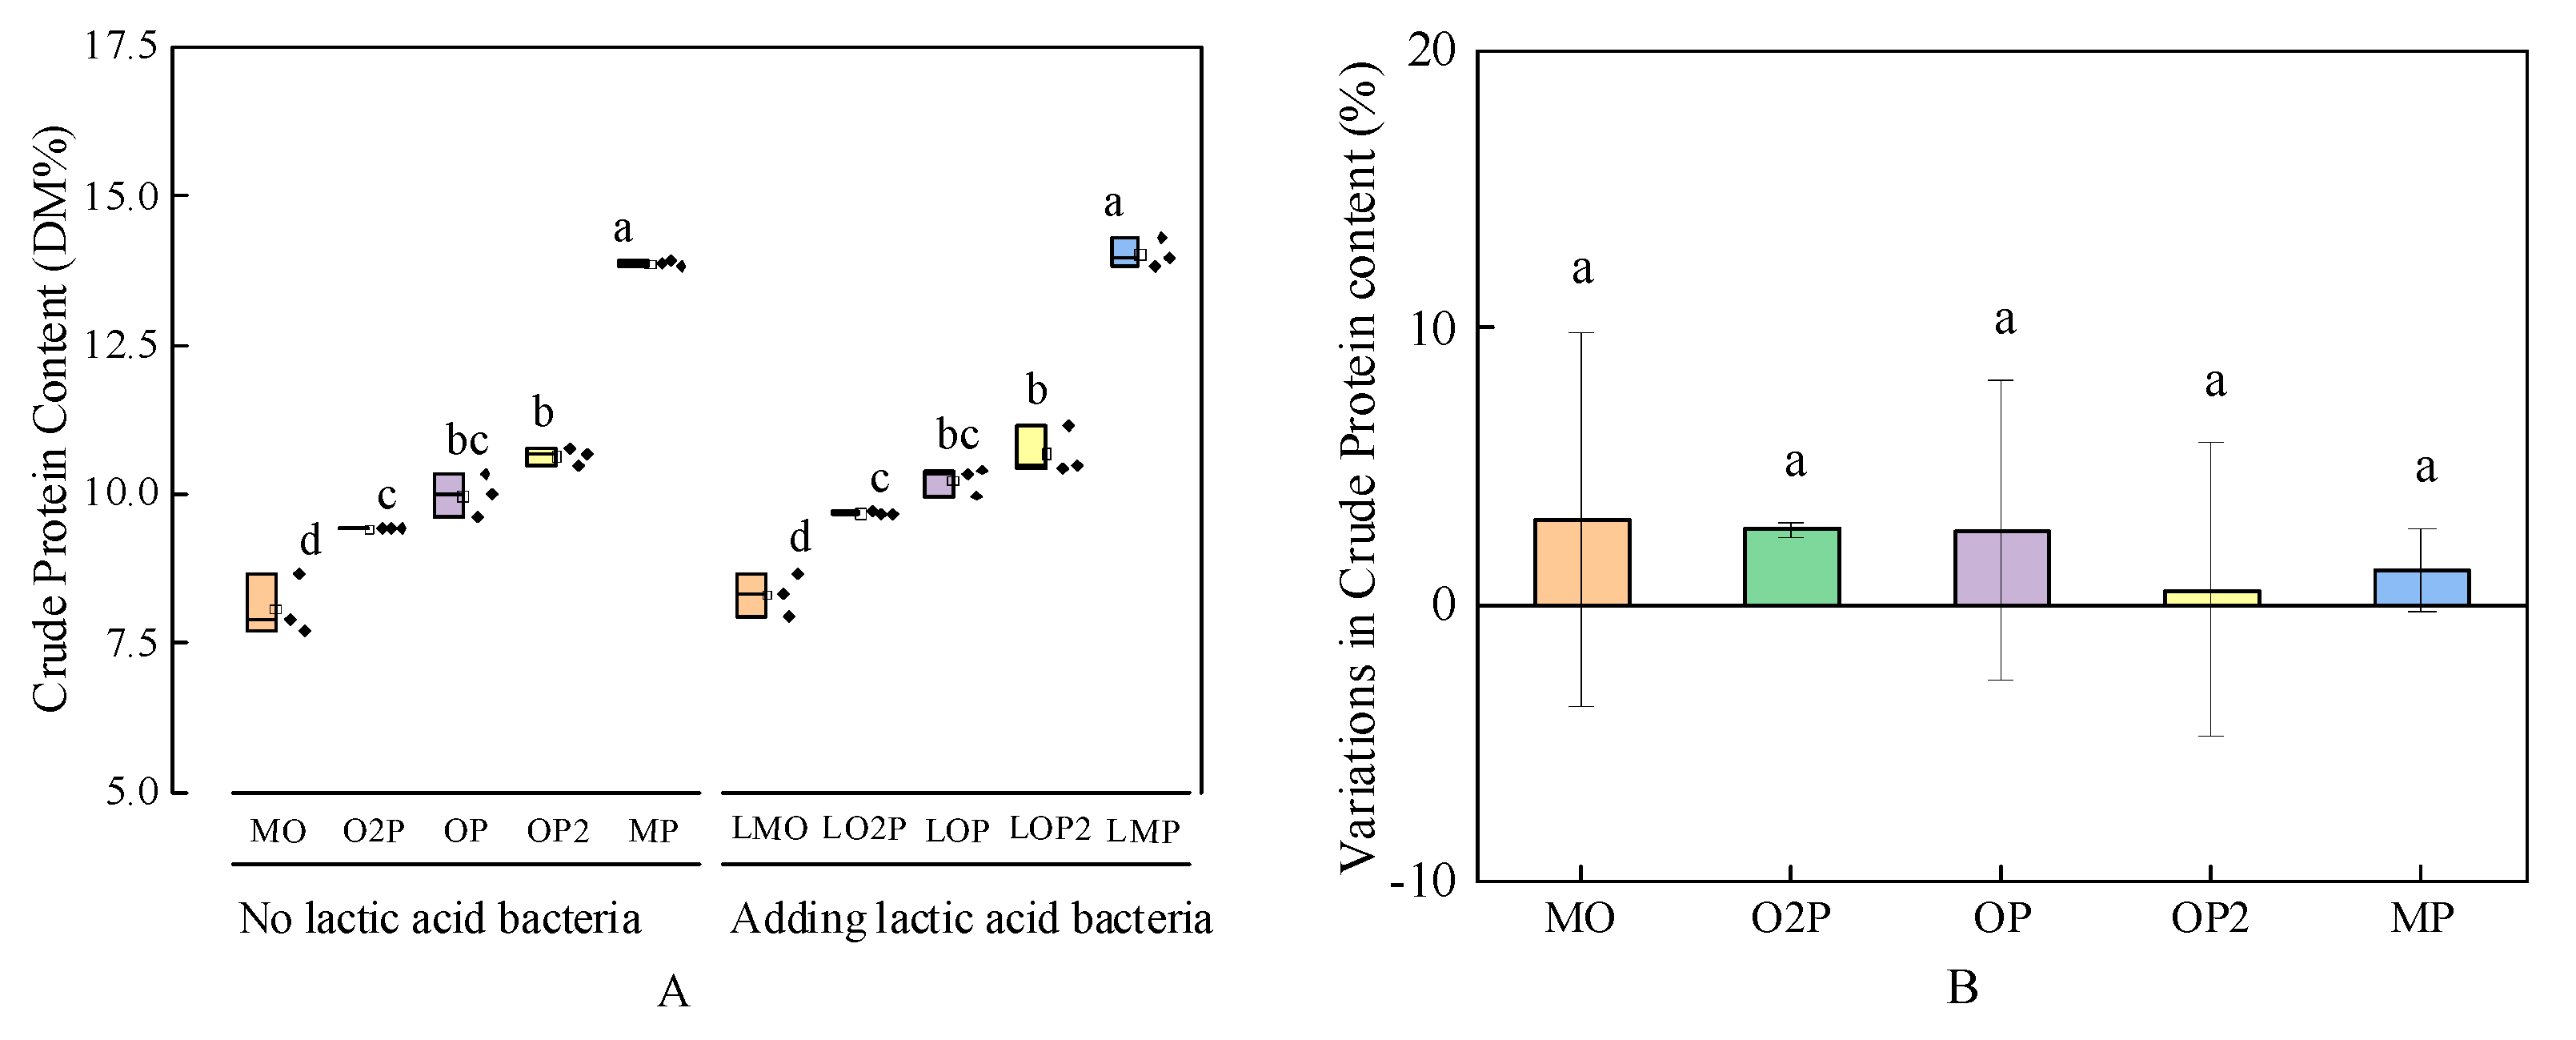
Effect of different mixed cropping ratios of oats and peas and lactic acid bacteria (LAB) additives on the crude protein (CP) content of silage (A) and variations in CP content for that with added LAB compared to that without added LAB at the end of the fermentation (B). Mean values in columns marked with the same letters do not differ significantly (p < 0.05). MO, O2P, OP, OP2, and MP represent oat–pea mixed cropping ratios of 1:0, 2:1, 1:1, 1:2, and 0:1, and the series is the silage treatment without lactic acid bacteria; the L series is the silage treatment with the addition of lactic acid bacteria (same as below).
Figure 4.
Effect of different mixed cropping ratios of oats and peas and lactic acid bacteria (LAB) additives on the crude protein (CP) content of silage (A) and variations in CP content for that with added LAB compared to that without added LAB at the end of the fermentation (B). Mean values in columns marked with the same letters do not differ significantly (p < 0.05). MO, O2P, OP, OP2, and MP represent oat–pea mixed cropping ratios of 1:0, 2:1, 1:1, 1:2, and 0:1, and the series is the silage treatment without lactic acid bacteria; the L series is the silage treatment with the addition of lactic acid bacteria (same as below).
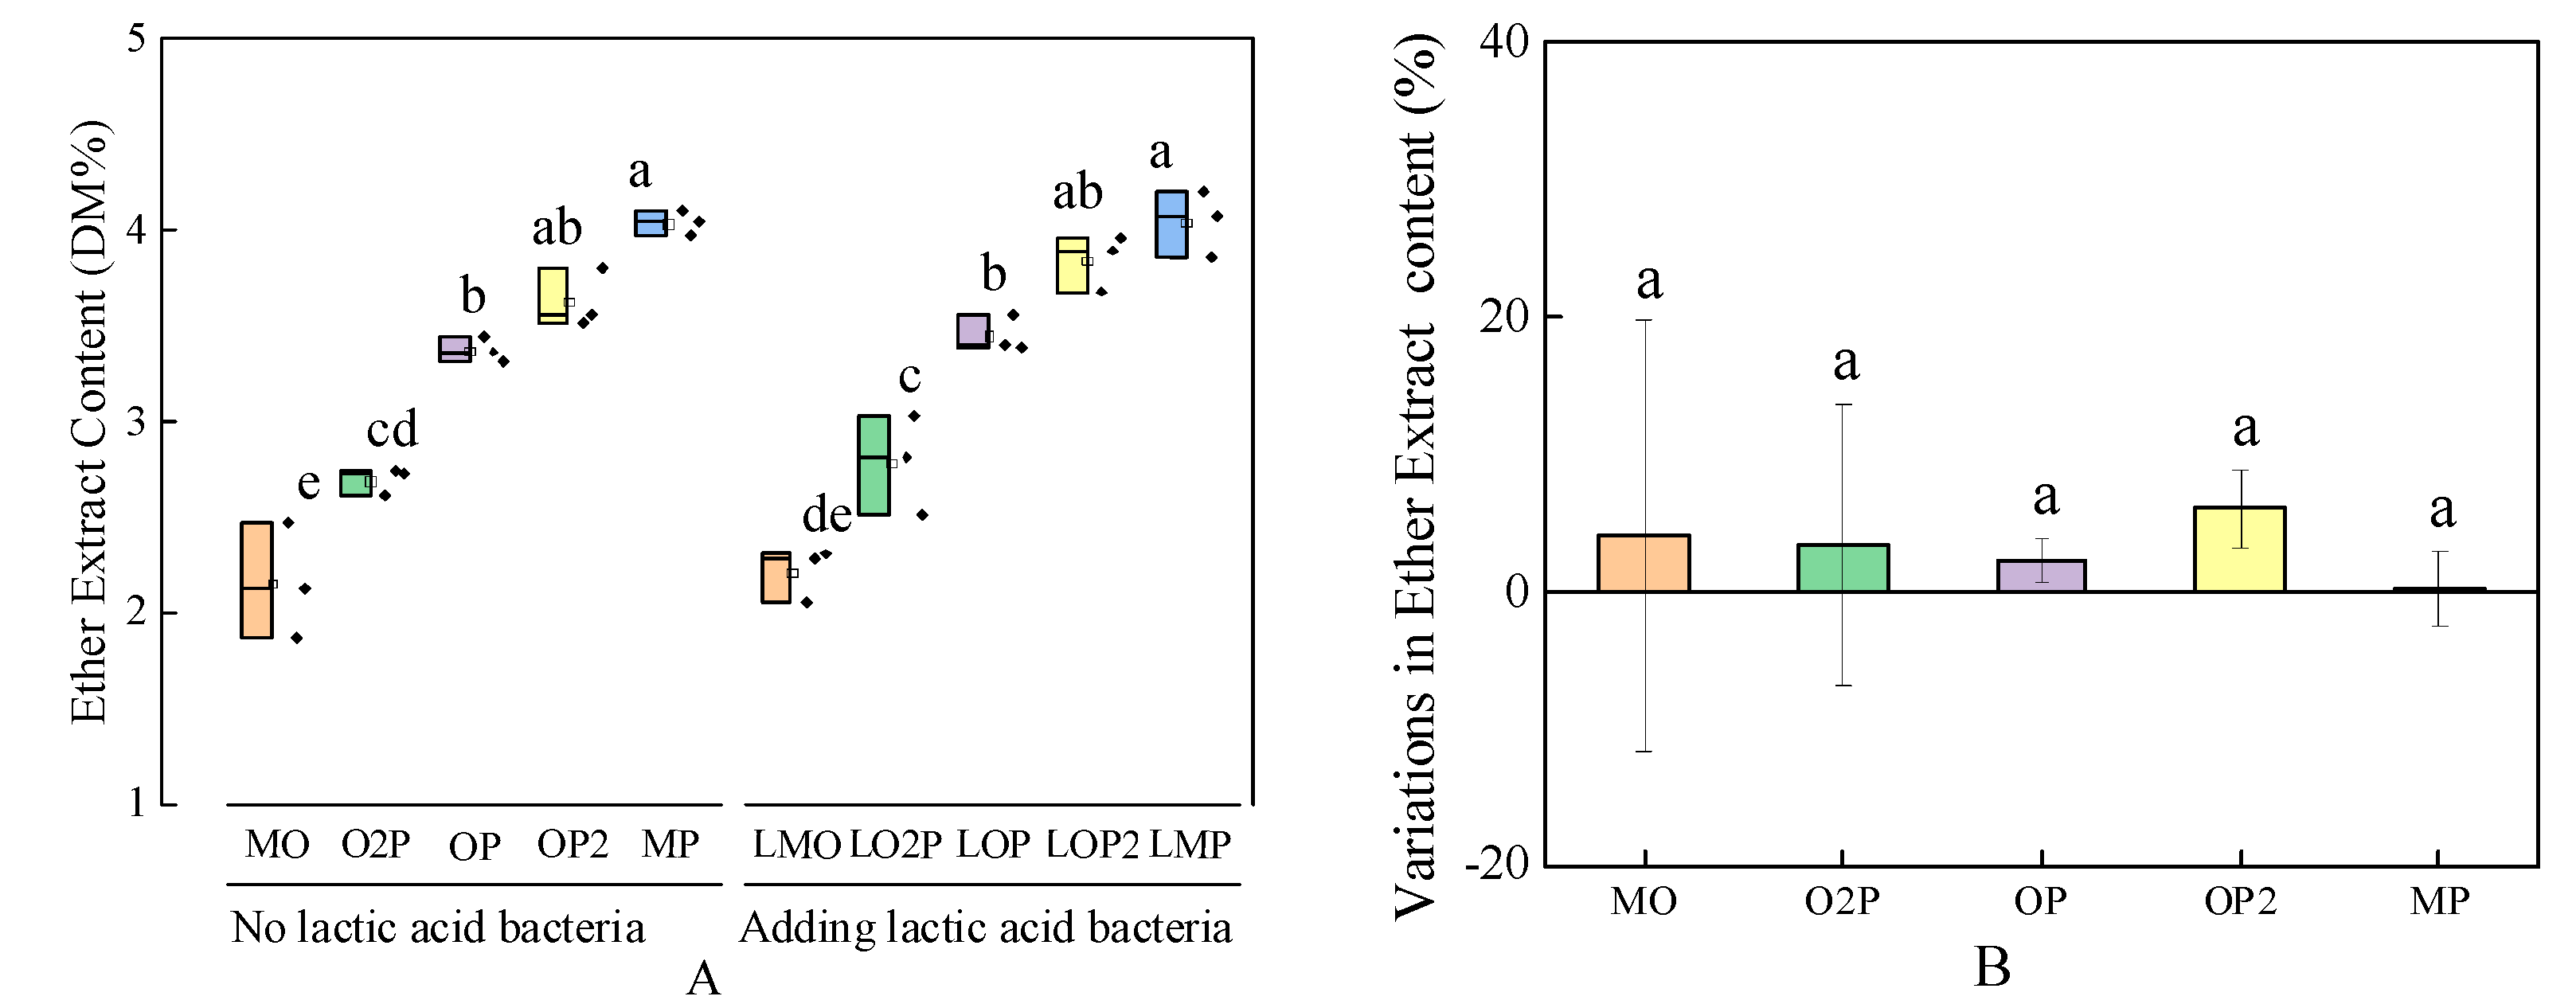
Effect of different mixed cropping ratios of oats and peas and lactic acid bacteria (LAB) additives on the ether extract (EE) content of silage (A) and variations in EE content for that with added LAB compared to that without added LAB at the end of the fermentation (B). Mean values in columns marked with the same letters do not differ significantly (p < 0.05). MO, O2P, OP, OP2, and MP represent oat–pea mixed cropping ratios of 1:0, 2:1, 1:1, 1:2, and 0:1, and the series is the silage treatment without lactic acid bacteria; the L series is the silage treatment with the addition of lactic acid bacteria (same as below).
Figure 5.
Effect of different mixed cropping ratios of oats and peas and lactic acid bacteria (LAB) additives on the ether extract (EE) content of silage (A) and variations in EE content for that with added LAB compared to that without added LAB at the end of the fermentation (B). Mean values in columns marked with the same letters do not differ significantly (p < 0.05). MO, O2P, OP, OP2, and MP represent oat–pea mixed cropping ratios of 1:0, 2:1, 1:1, 1:2, and 0:1, and the series is the silage treatment without lactic acid bacteria; the L series is the silage treatment with the addition of lactic acid bacteria (same as below).
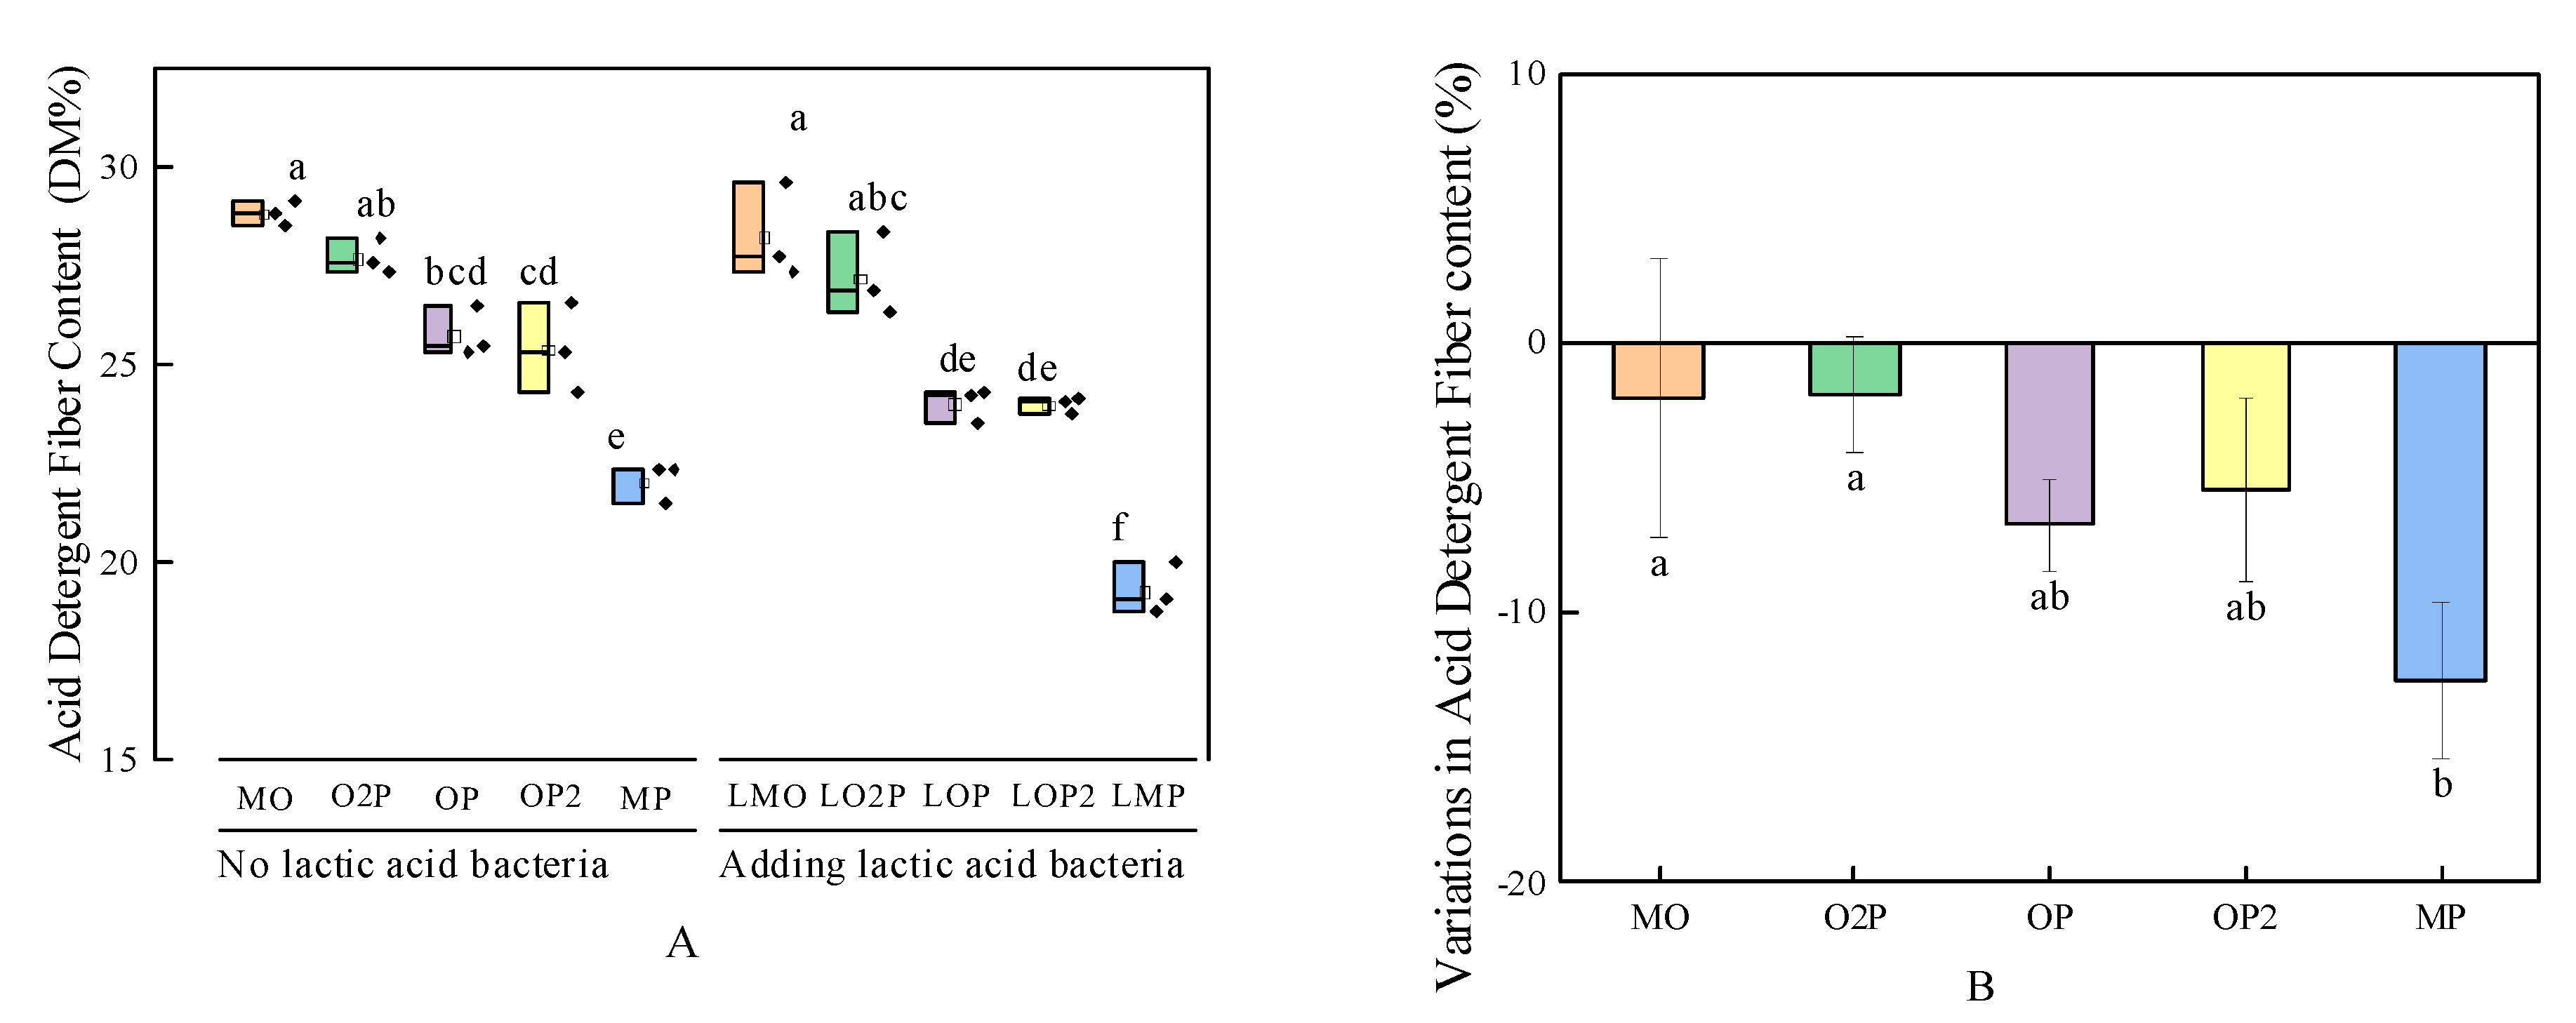
Effect of different mixed cropping ratios of oats and peas and lactic acid bacteria (LAB) additives on the acid detergent fiber (ADF) content of silage (A) and variations in ADF content for that with added LAB compared to that without added LAB at the end of the fermentation (B). Mean values in columns marked with the same letters do not differ significantly (p < 0.05). MO, O2P, OP, OP2, and MP represent oat–pea mixed cropping ratios of 1:0, 2:1, 1:1, 1:2, and 0:1, and the series is the silage treatment without lactic acid bacteria; the L series is the silage treatment with the addition of lactic acid bacteria (same as below).
Figure 6.
Effect of different mixed cropping ratios of oats and peas and lactic acid bacteria (LAB) additives on the acid detergent fiber (ADF) content of silage (A) and variations in ADF content for that with added LAB compared to that without added LAB at the end of the fermentation (B). Mean values in columns marked with the same letters do not differ significantly (p < 0.05). MO, O2P, OP, OP2, and MP represent oat–pea mixed cropping ratios of 1:0, 2:1, 1:1, 1:2, and 0:1, and the series is the silage treatment without lactic acid bacteria; the L series is the silage treatment with the addition of lactic acid bacteria (same as below).
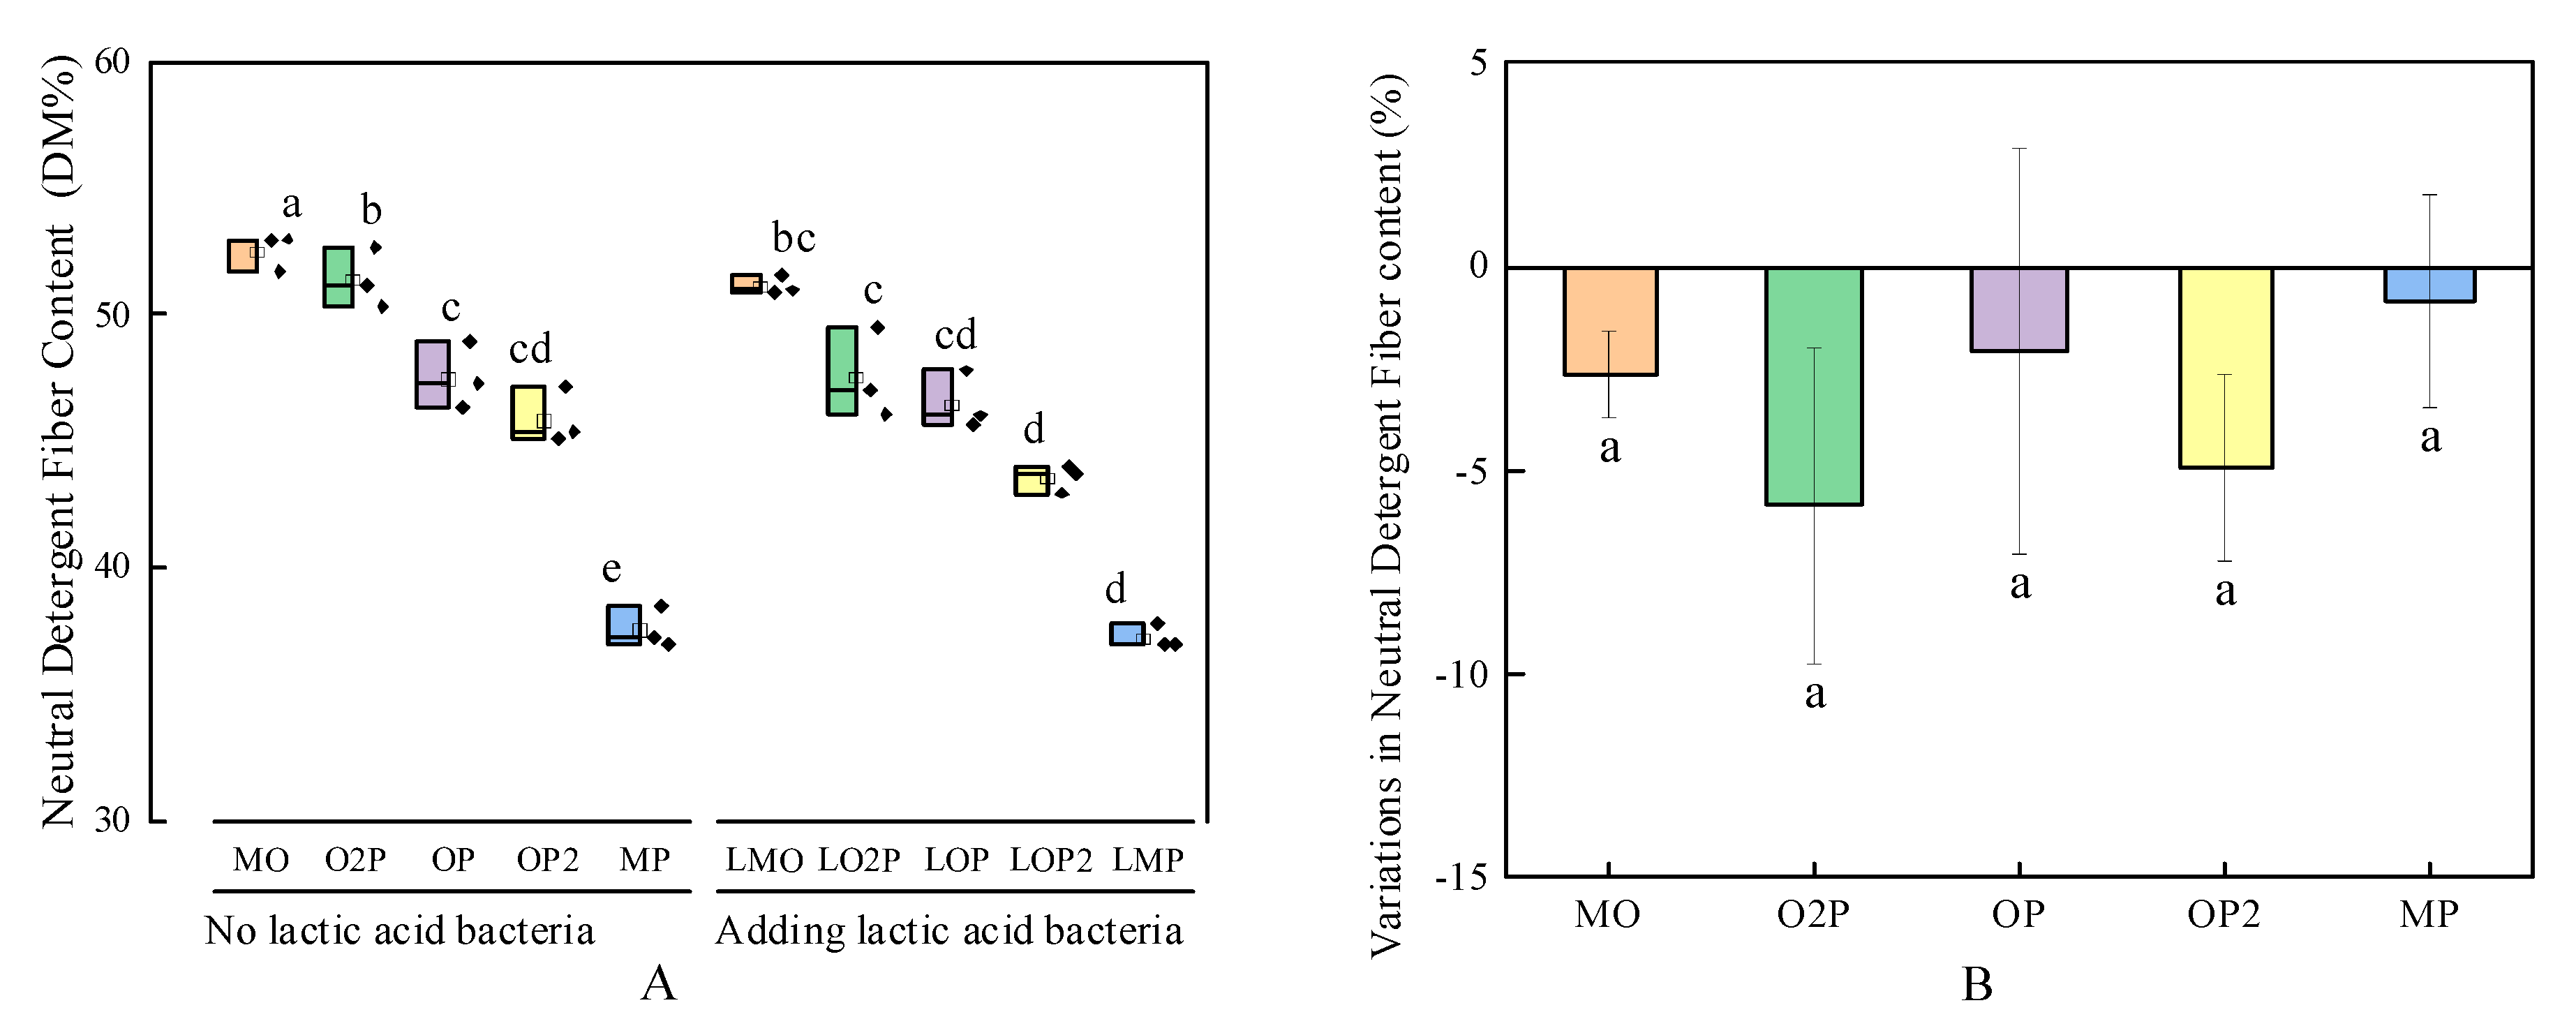
Effect of different mixed cropping ratios of oats and peas and lactic acid bacteria (LAB) additives on the neutral detergent fiber (NDF) content of silage (A) and variations in NDF content for that with added LAB compared to that without added LAB at the end of the fermentation (B). Mean values in columns marked with the same letters do not differ significantly (p < 0.05). MO, O2P, OP, OP2, and MP represent oat–pea mixed cropping ratios of 1:0, 2:1, 1:1, 1:2, and 0:1, and the series is the silage treatment without lactic acid bacteria; the L series is the silage treatment with the addition of lactic acid bacteria (same as below).
Figure 7.
Effect of different mixed cropping ratios of oats and peas and lactic acid bacteria (LAB) additives on the neutral detergent fiber (NDF) content of silage (A) and variations in NDF content for that with added LAB compared to that without added LAB at the end of the fermentation (B). Mean values in columns marked with the same letters do not differ significantly (p < 0.05). MO, O2P, OP, OP2, and MP represent oat–pea mixed cropping ratios of 1:0, 2:1, 1:1, 1:2, and 0:1, and the series is the silage treatment without lactic acid bacteria; the L series is the silage treatment with the addition of lactic acid bacteria (same as below).
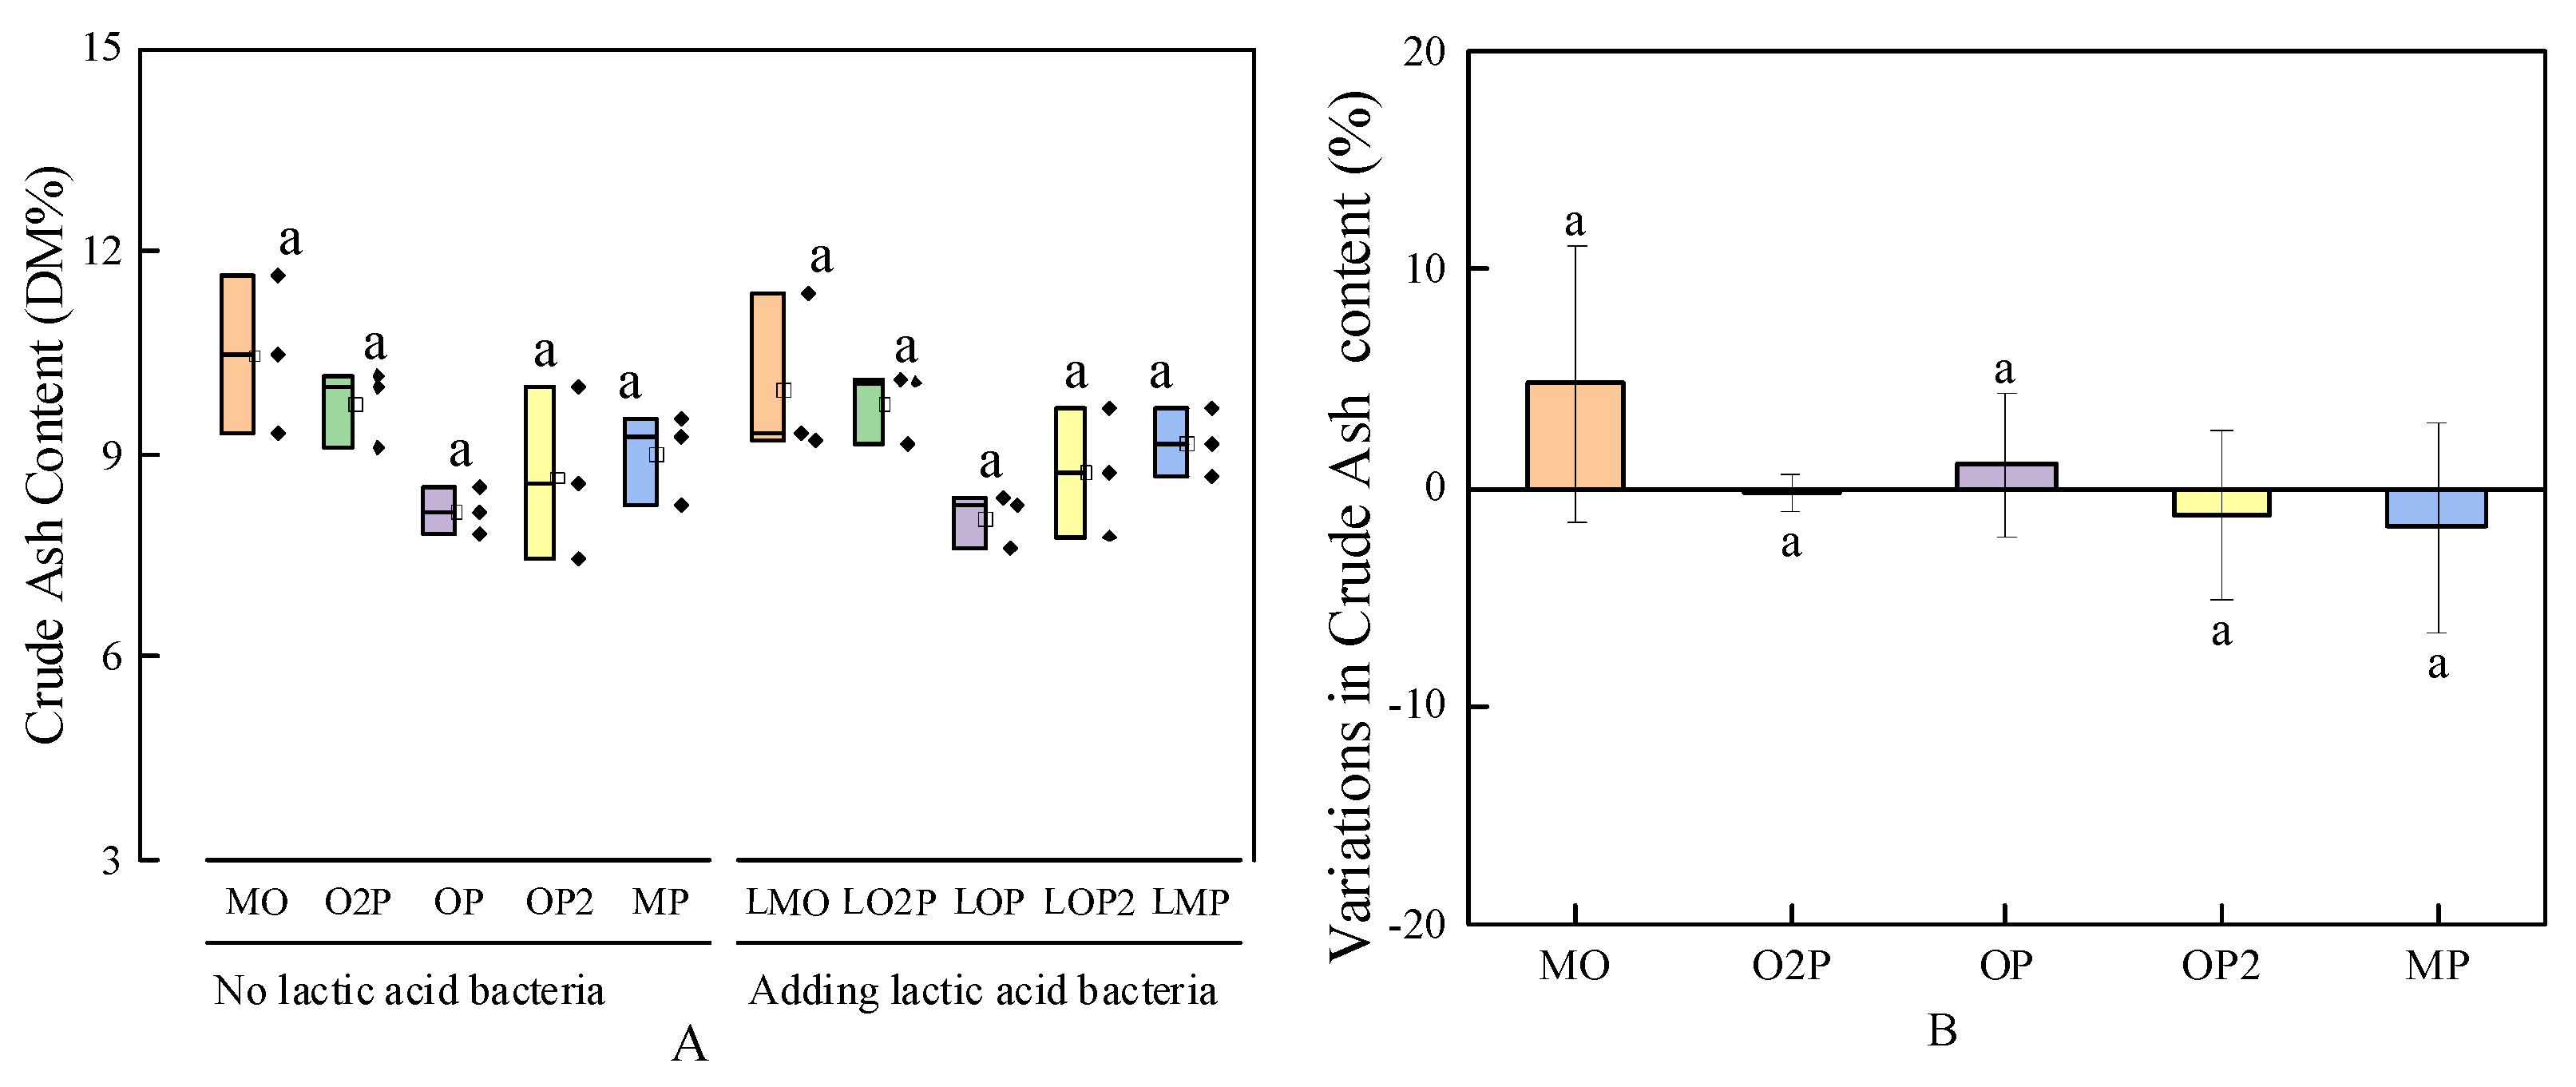
Effect of different mixed cropping ratios of oats and peas and lactic acid bacteria (LAB) additives on the crude ash (Ash) content of silage (A) and variations in Ash content for that with added LAB compared to that without added LAB at the end of the fermentation (B). Mean values in columns marked with the same letters do not differ significantly (p < 0.05). MO, O2P, OP, OP2, and MP represent oat–pea mixed cropping ratios of 1:0, 2:1, 1:1, 1:2, and 0:1, and the series is the silage treatment without lactic acid bacteria; the L series is the silage treatment with the addition of lactic acid bacteria (same as below).
Figure 8.
Effect of different mixed cropping ratios of oats and peas and lactic acid bacteria (LAB) additives on the crude ash (Ash) content of silage (A) and variations in Ash content for that with added LAB compared to that without added LAB at the end of the fermentation (B). Mean values in columns marked with the same letters do not differ significantly (p < 0.05). MO, O2P, OP, OP2, and MP represent oat–pea mixed cropping ratios of 1:0, 2:1, 1:1, 1:2, and 0:1, and the series is the silage treatment without lactic acid bacteria; the L series is the silage treatment with the addition of lactic acid bacteria (same as below).
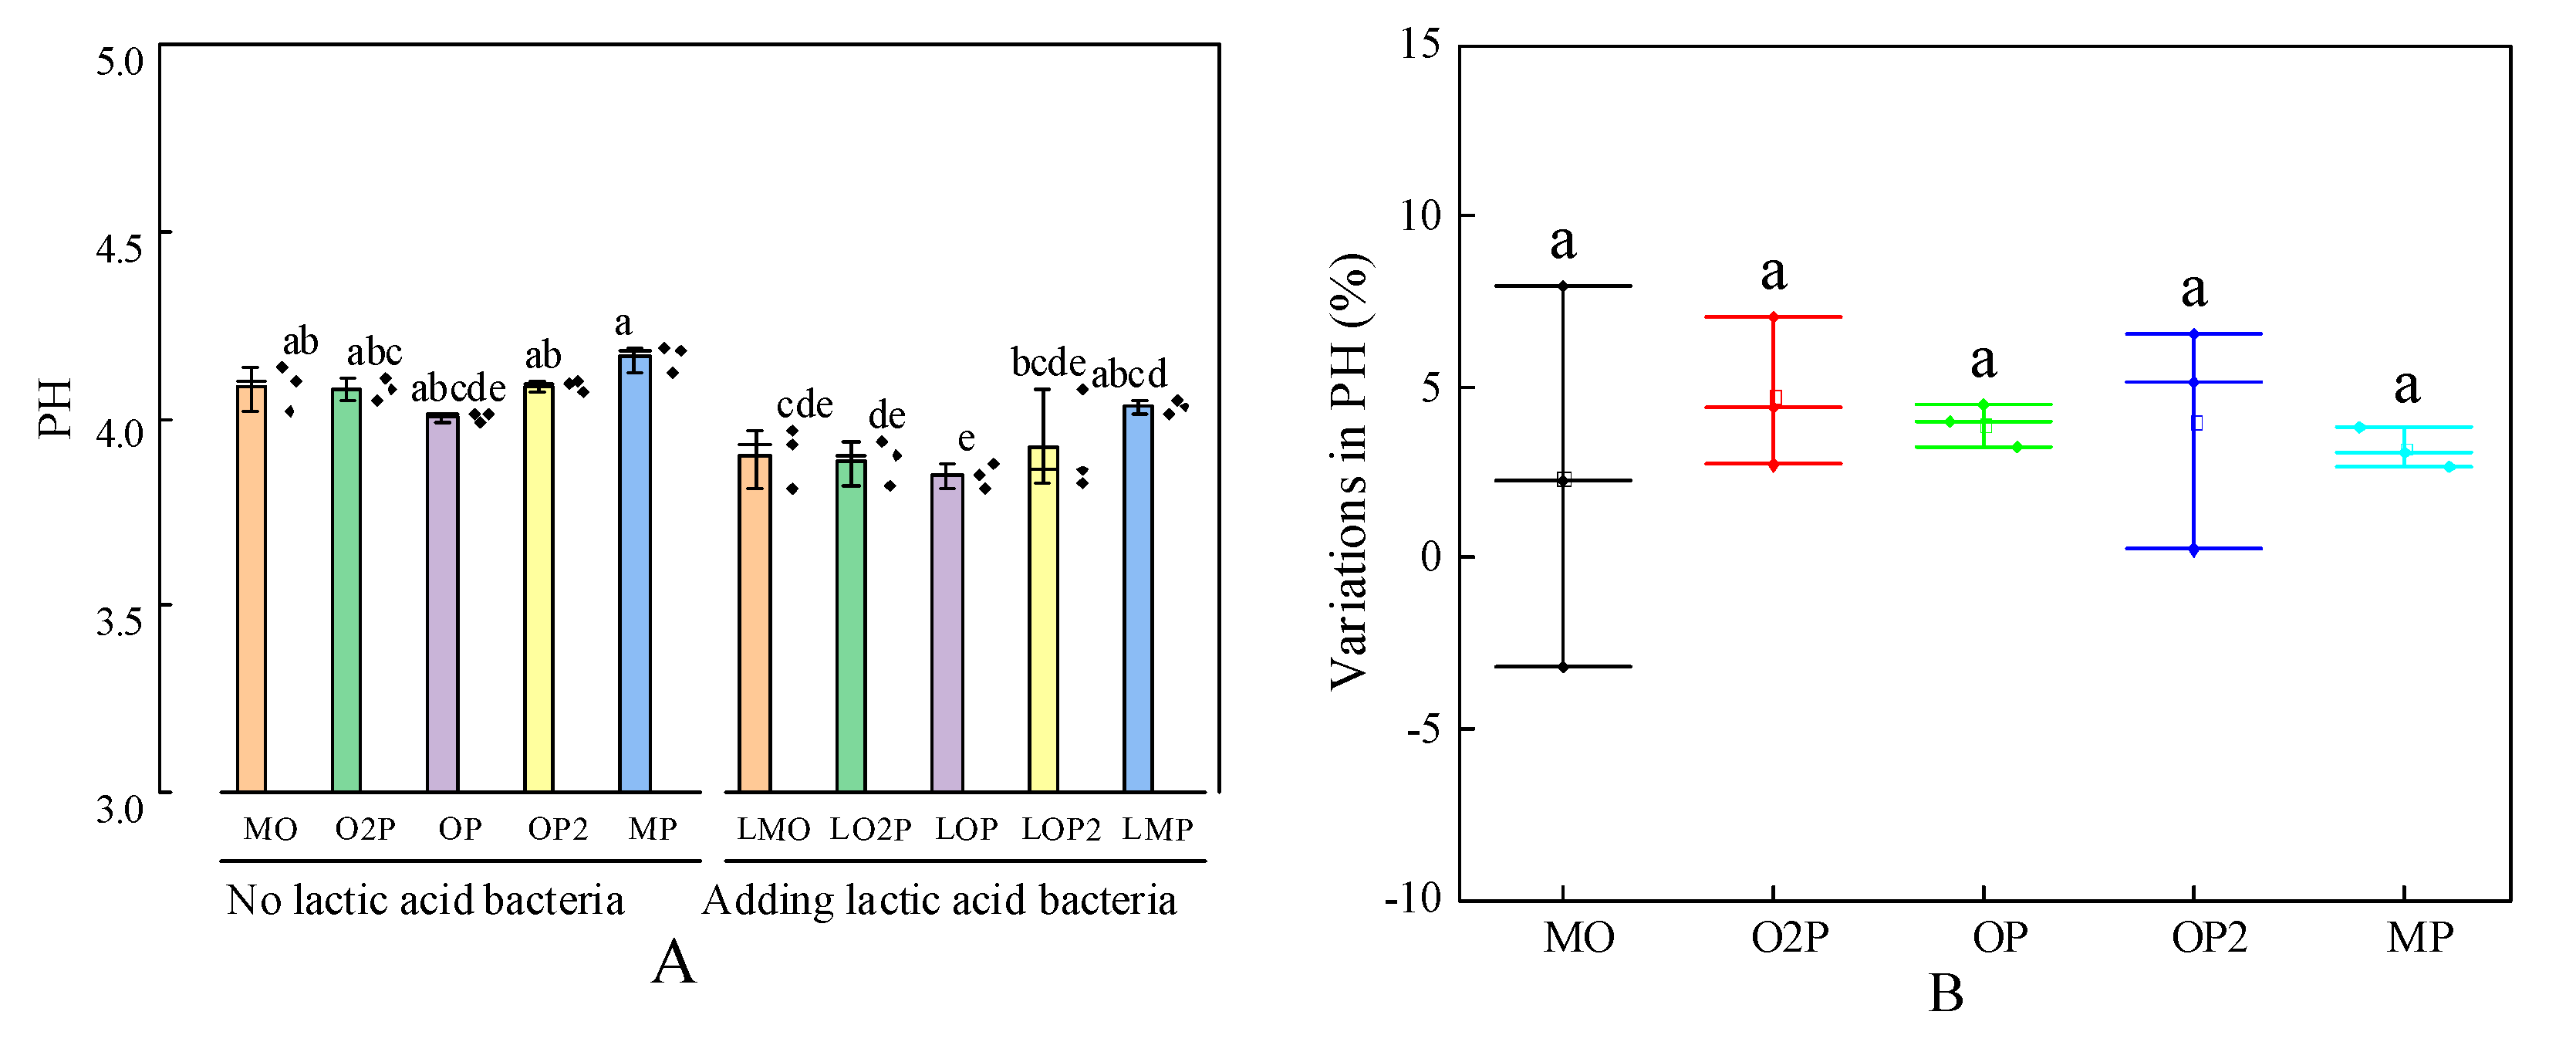
Effect of different mixed cropping ratios of oats and peas and lactic acid bacteria (LAB) additives on the pH of silage (A) and variations in pH value of the silage with added LAB compared to that without LAB at the end of the fermentation (B). Mean values in columns marked with the same letters do not differ significantly (p < 0.05). MO, O2P, OP, OP2, and MP represent oat–pea mixed cropping ratios of 1:0, 2:1, 1:1, 1:2, and 0:1, and the series is the silage treatment without lactic acid bacteria; the L series is the silage treatment with the addition of lactic acid bacteria (same as below).
Figure 9.
Effect of different mixed cropping ratios of oats and peas and lactic acid bacteria (LAB) additives on the pH of silage (A) and variations in pH value of the silage with added LAB compared to that without LAB at the end of the fermentation (B). Mean values in columns marked with the same letters do not differ significantly (p < 0.05). MO, O2P, OP, OP2, and MP represent oat–pea mixed cropping ratios of 1:0, 2:1, 1:1, 1:2, and 0:1, and the series is the silage treatment without lactic acid bacteria; the L series is the silage treatment with the addition of lactic acid bacteria (same as below).
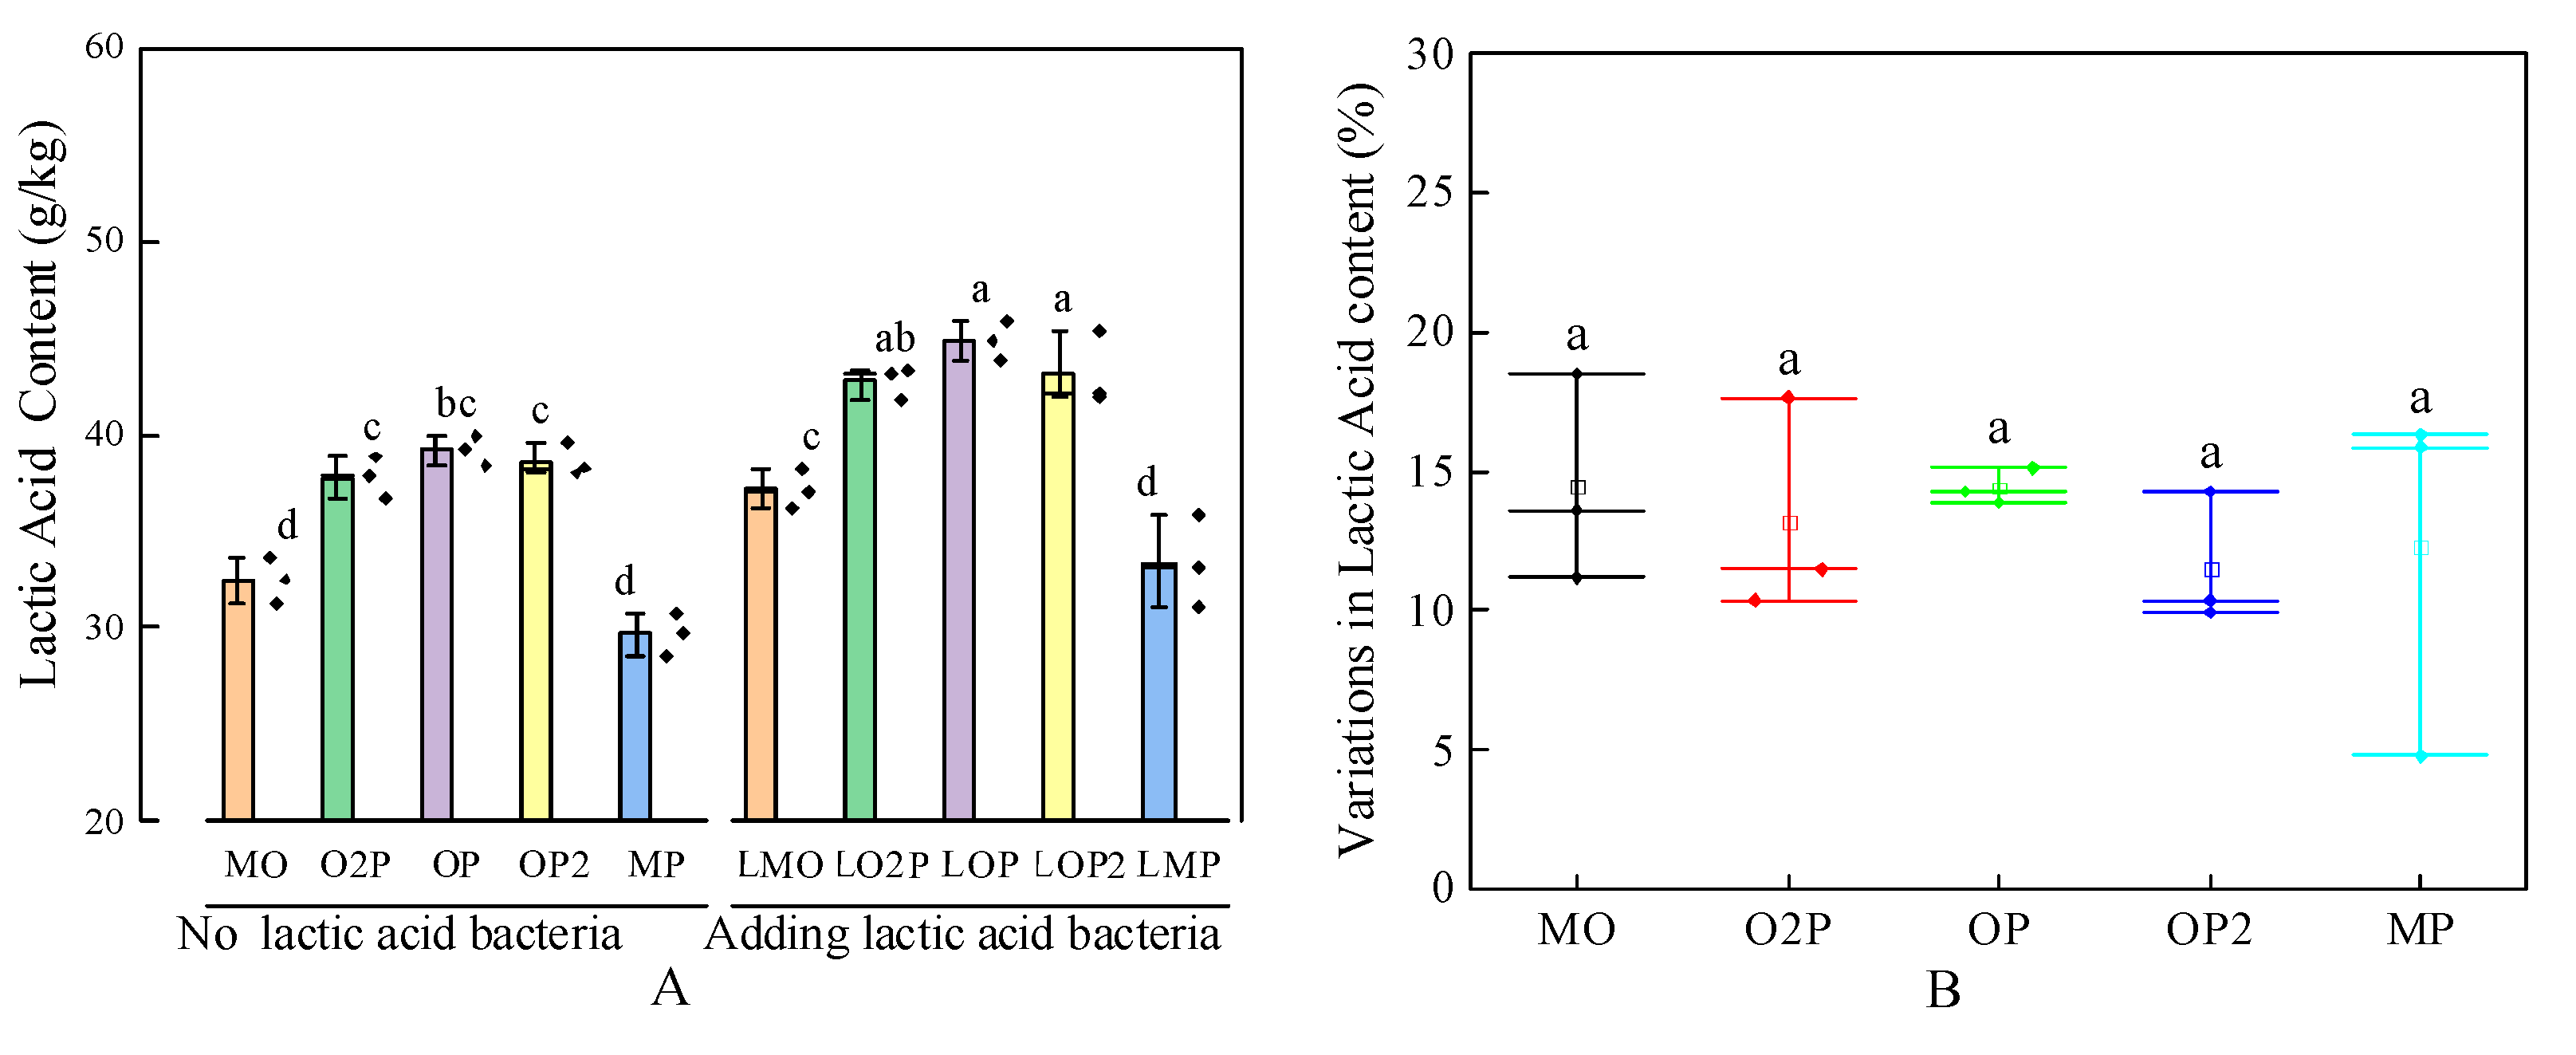
Effect of different mixed cropping ratios of oats and peas and lactic acid bacteria (LAB) additives on the crude lactic acid (LA) content of silage (A) and variations in LA content for that with added LAB compared to that without LAB at the end of the fermentation (B). Mean values in columns marked with the same letters do not differ significantly (p < 0.05). MO, O2P, OP, OP2, and MP represent oat–pea mixed cropping ratios of 1:0, 2:1, 1:1, 1:2, and 0:1, and the series is the silage treatment without lactic acid bacteria; the L series is the silage treatment with the addition of lactic acid bacteria (same as below).
Figure 10.
Effect of different mixed cropping ratios of oats and peas and lactic acid bacteria (LAB) additives on the crude lactic acid (LA) content of silage (A) and variations in LA content for that with added LAB compared to that without LAB at the end of the fermentation (B). Mean values in columns marked with the same letters do not differ significantly (p < 0.05). MO, O2P, OP, OP2, and MP represent oat–pea mixed cropping ratios of 1:0, 2:1, 1:1, 1:2, and 0:1, and the series is the silage treatment without lactic acid bacteria; the L series is the silage treatment with the addition of lactic acid bacteria (same as below).
Effect of different mixed cropping ratios of oats and peas and lactic acid bacteria (LAB) additives on the crude acetic acid (AA) content of silage (A) and variations in AA content for that with starter added LAB at the end of the fermentation (B). Mean values in columns marked with the same letters do not differ significantly (p < 0.05). MO, O2P, OP, OP2, and MP represent oat–pea mixed cropping ratios of 1:0, 2:1, 1:1, 1:2, and 0:1, and the series is the silage treatment without lactic acid bacteria; the L series is the silage treatment with the addition of lactic acid bacteria (same as below).
Figure 11.
Effect of different mixed cropping ratios of oats and peas and lactic acid bacteria (LAB) additives on the crude acetic acid (AA) content of silage (A) and variations in AA content for that with starter added LAB at the end of the fermentation (B). Mean values in columns marked with the same letters do not differ significantly (p < 0.05). MO, O2P, OP, OP2, and MP represent oat–pea mixed cropping ratios of 1:0, 2:1, 1:1, 1:2, and 0:1, and the series is the silage treatment without lactic acid bacteria; the L series is the silage treatment with the addition of lactic acid bacteria (same as below).

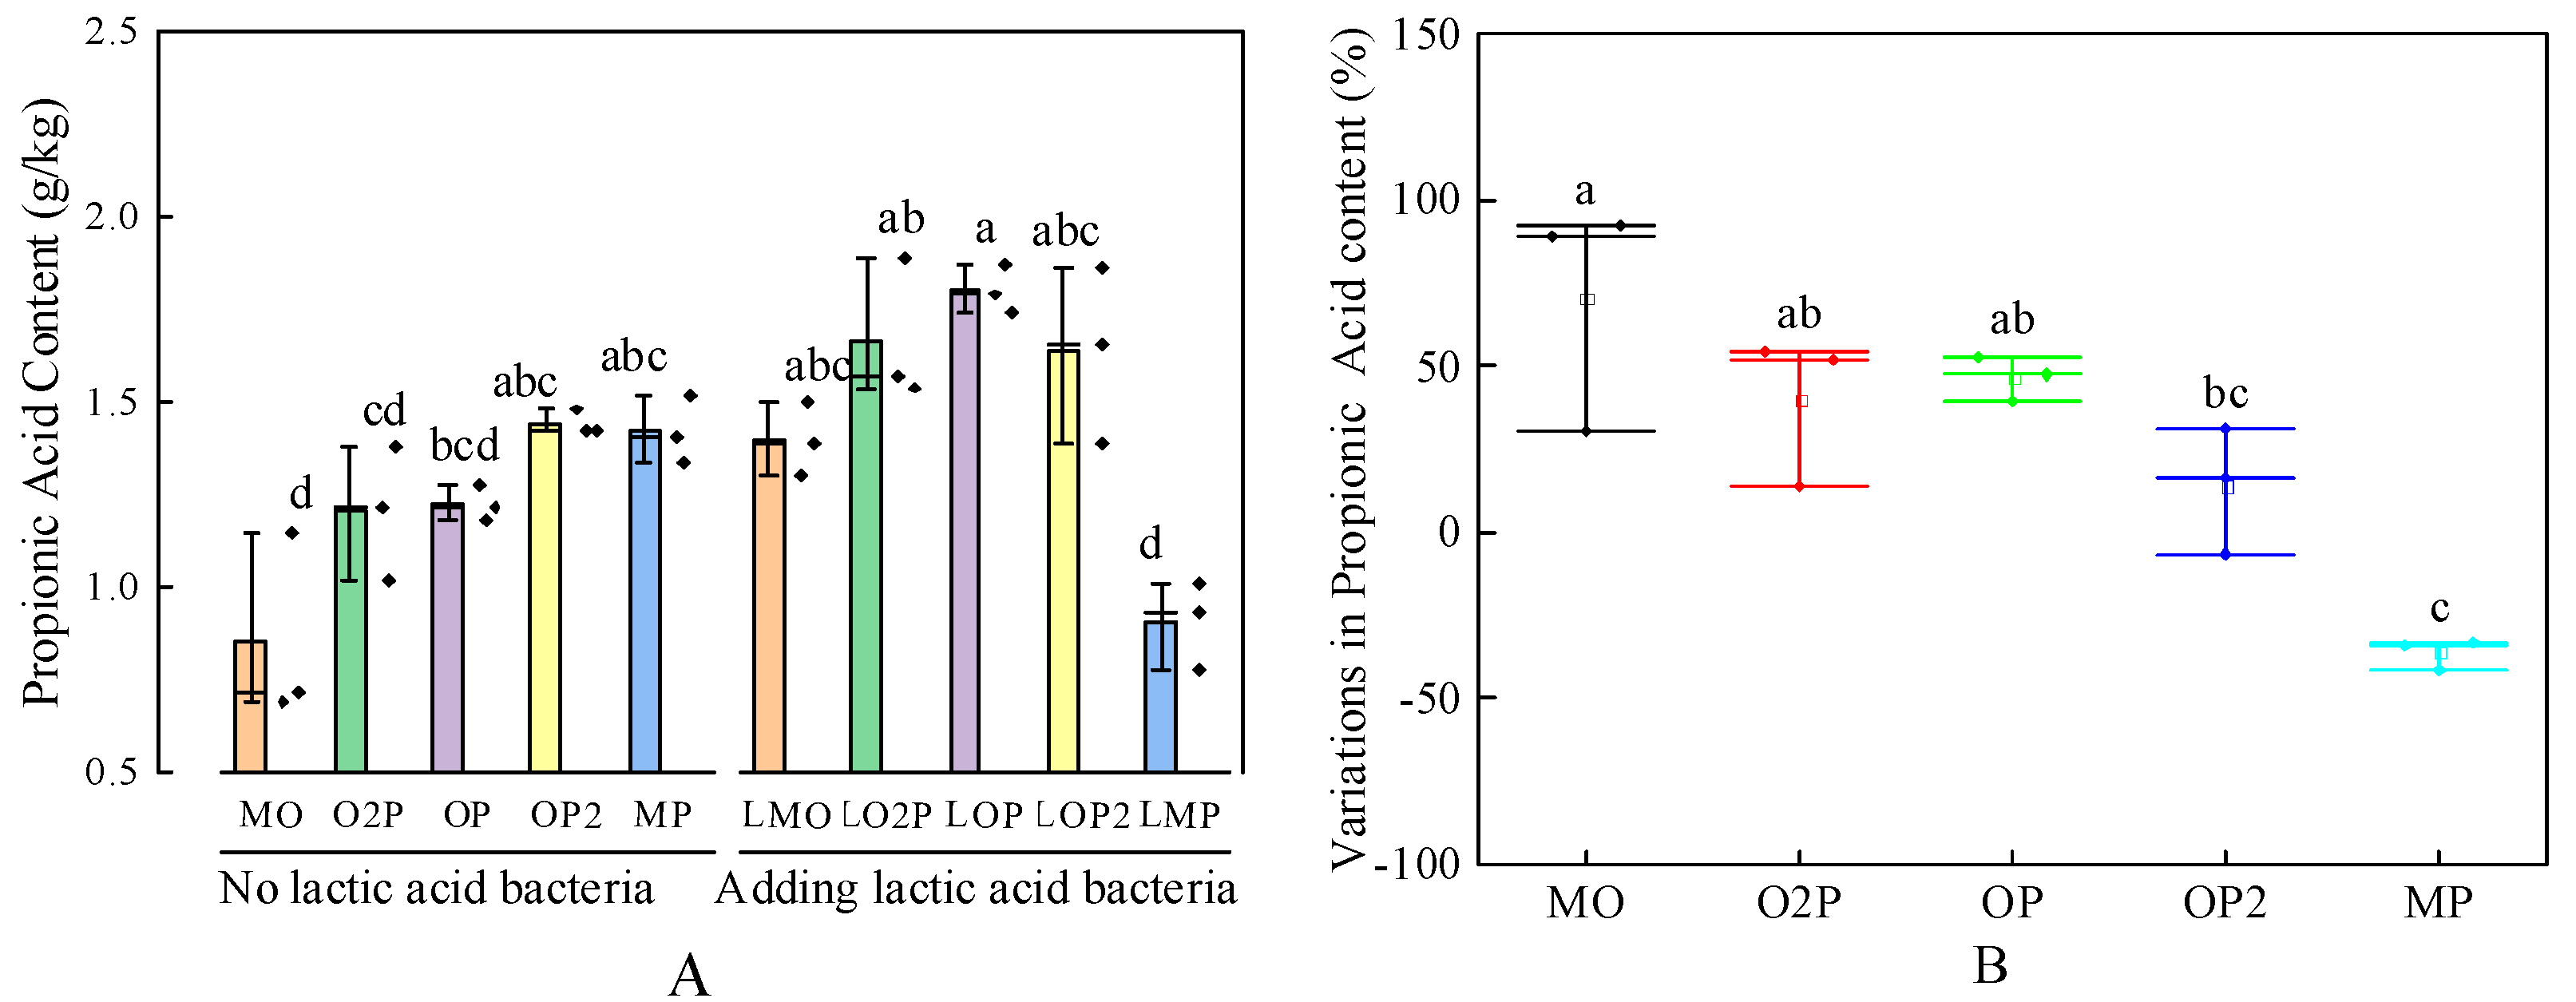
Effect of different mixed cropping ratios of oats and peas and lactic acid bacteria (LAB) additives on the propionic acid (PA) content of silage (A) and variations in PA content for that with added LAB compared to that without added LAB at the end of the fermentation (B). Mean values in columns marked with the same letters do not differ significantly (p < 0.05). MO, O2P, OP, OP2, and MP represent oat–pea mixed cropping ratios of 1:0, 2:1, 1:1, 1:2, and 0:1, and the series is the silage treatment without lactic acid bacteria; the L series is the silage treatment with the addition of lactic acid bacteria (same as below).
Figure 12.
Effect of different mixed cropping ratios of oats and peas and lactic acid bacteria (LAB) additives on the propionic acid (PA) content of silage (A) and variations in PA content for that with added LAB compared to that without added LAB at the end of the fermentation (B). Mean values in columns marked with the same letters do not differ significantly (p < 0.05). MO, O2P, OP, OP2, and MP represent oat–pea mixed cropping ratios of 1:0, 2:1, 1:1, 1:2, and 0:1, and the series is the silage treatment without lactic acid bacteria; the L series is the silage treatment with the addition of lactic acid bacteria (same as below).
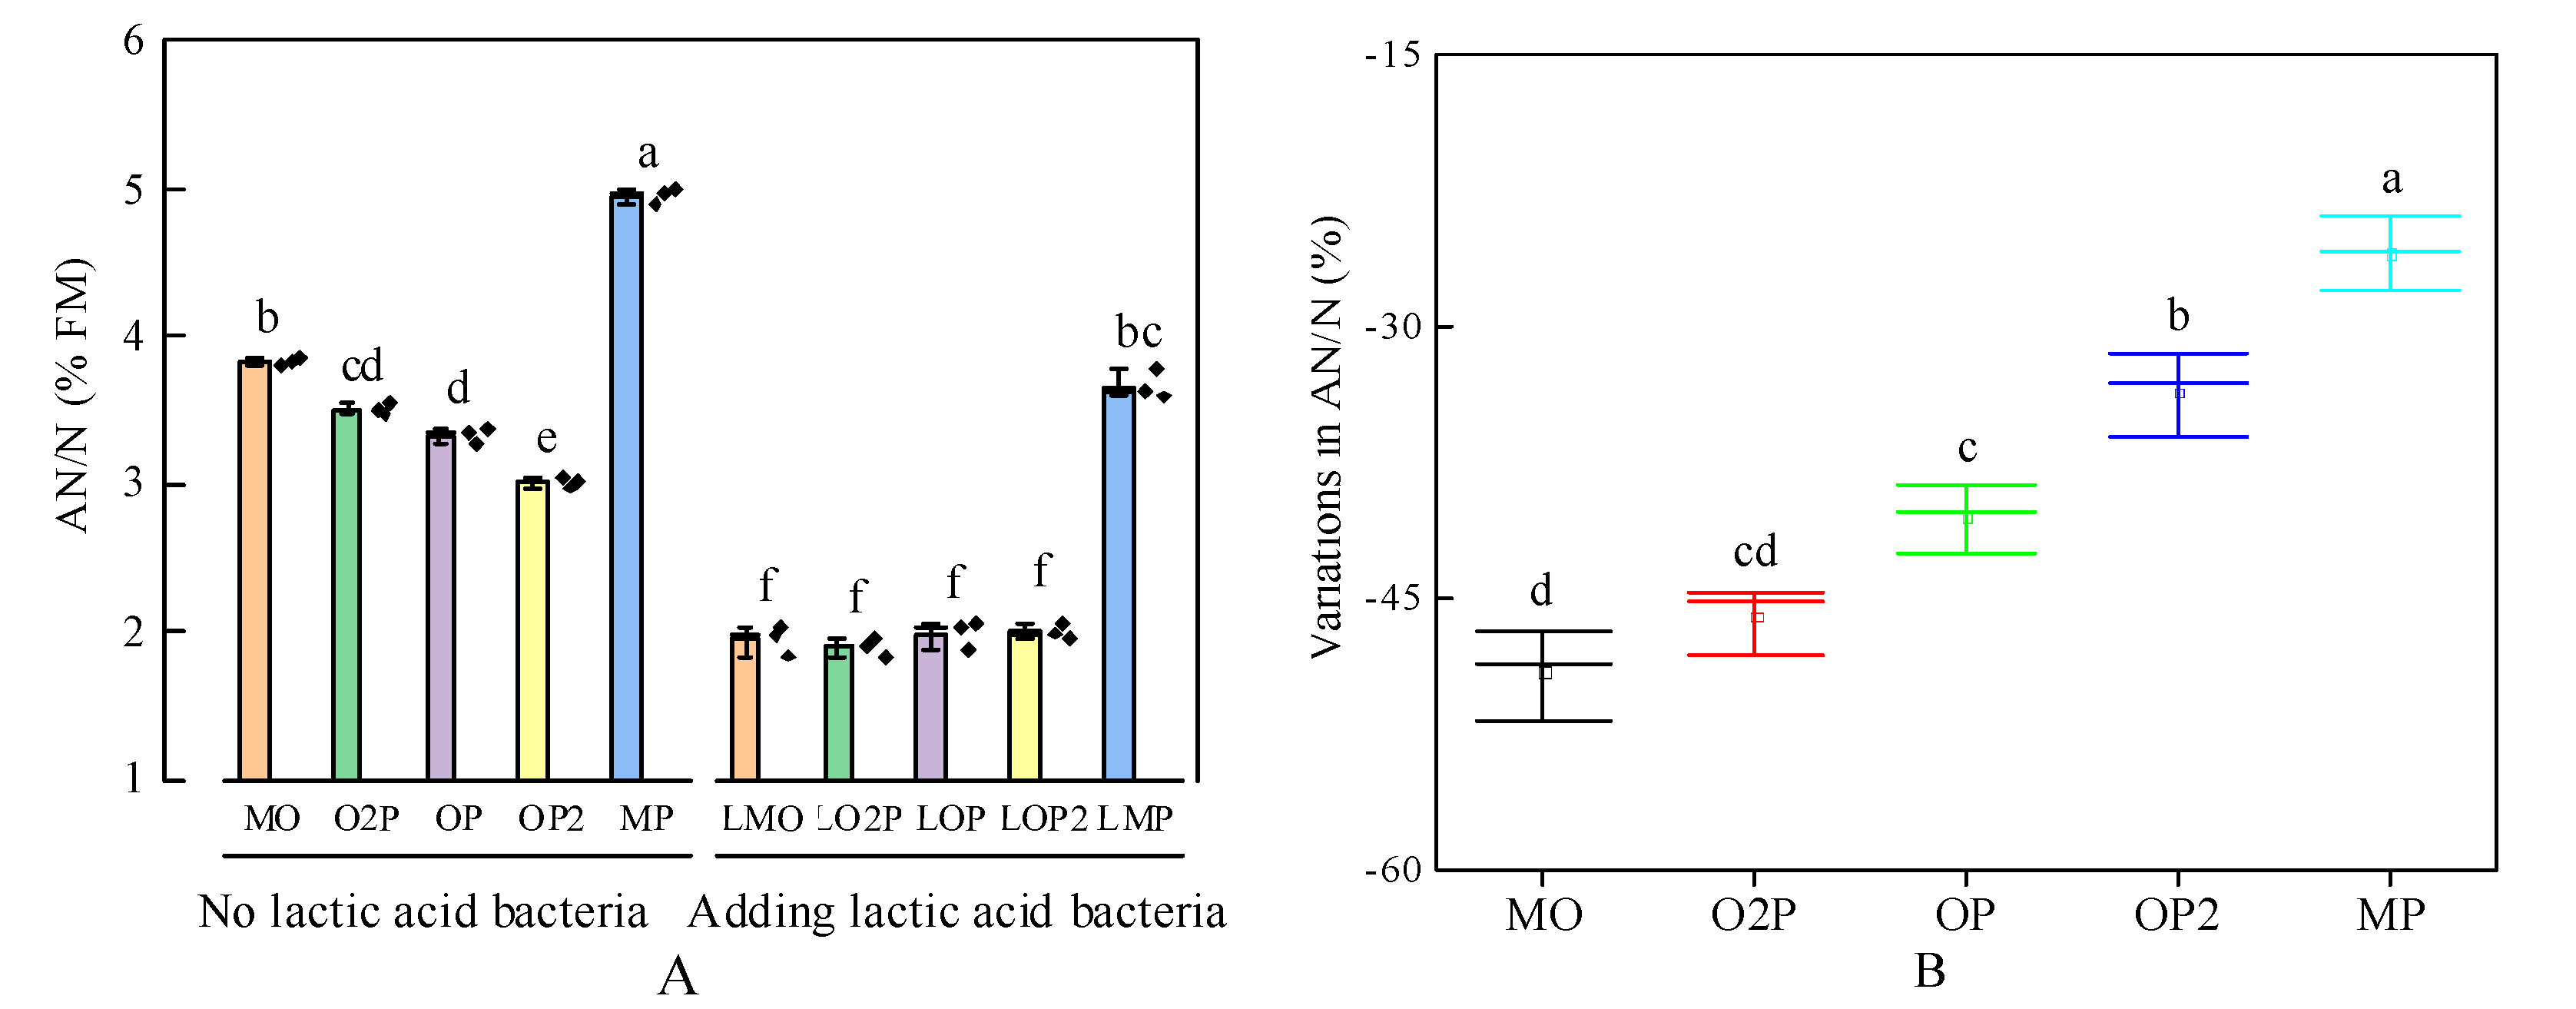
Effect of different mixed cropping ratios of oats and peas and lactic acid bacteria (LAB) additives on the ratio of ammonia nitrogen to total nitrogen (AN/N) of silage (A) and variations in AN/N for that with added LAB compared to that without added LAB at the end of the fermentation (B). Mean values in columns marked with the same letters do not differ significantly (p < 0.05). MO, O2P, OP, OP2, and MP represent oat–pea mixed cropping ratios of 1:0, 2:1, 1:1, 1:2, and 0:1, and the series is the silage treatment without lactic acid bacteria; the L series is the silage treatment with the addition of lactic acid bacteria (same as below).
Figure 13.
Effect of different mixed cropping ratios of oats and peas and lactic acid bacteria (LAB) additives on the ratio of ammonia nitrogen to total nitrogen (AN/N) of silage (A) and variations in AN/N for that with added LAB compared to that without added LAB at the end of the fermentation (B). Mean values in columns marked with the same letters do not differ significantly (p < 0.05). MO, O2P, OP, OP2, and MP represent oat–pea mixed cropping ratios of 1:0, 2:1, 1:1, 1:2, and 0:1, and the series is the silage treatment without lactic acid bacteria; the L series is the silage treatment with the addition of lactic acid bacteria (same as below).
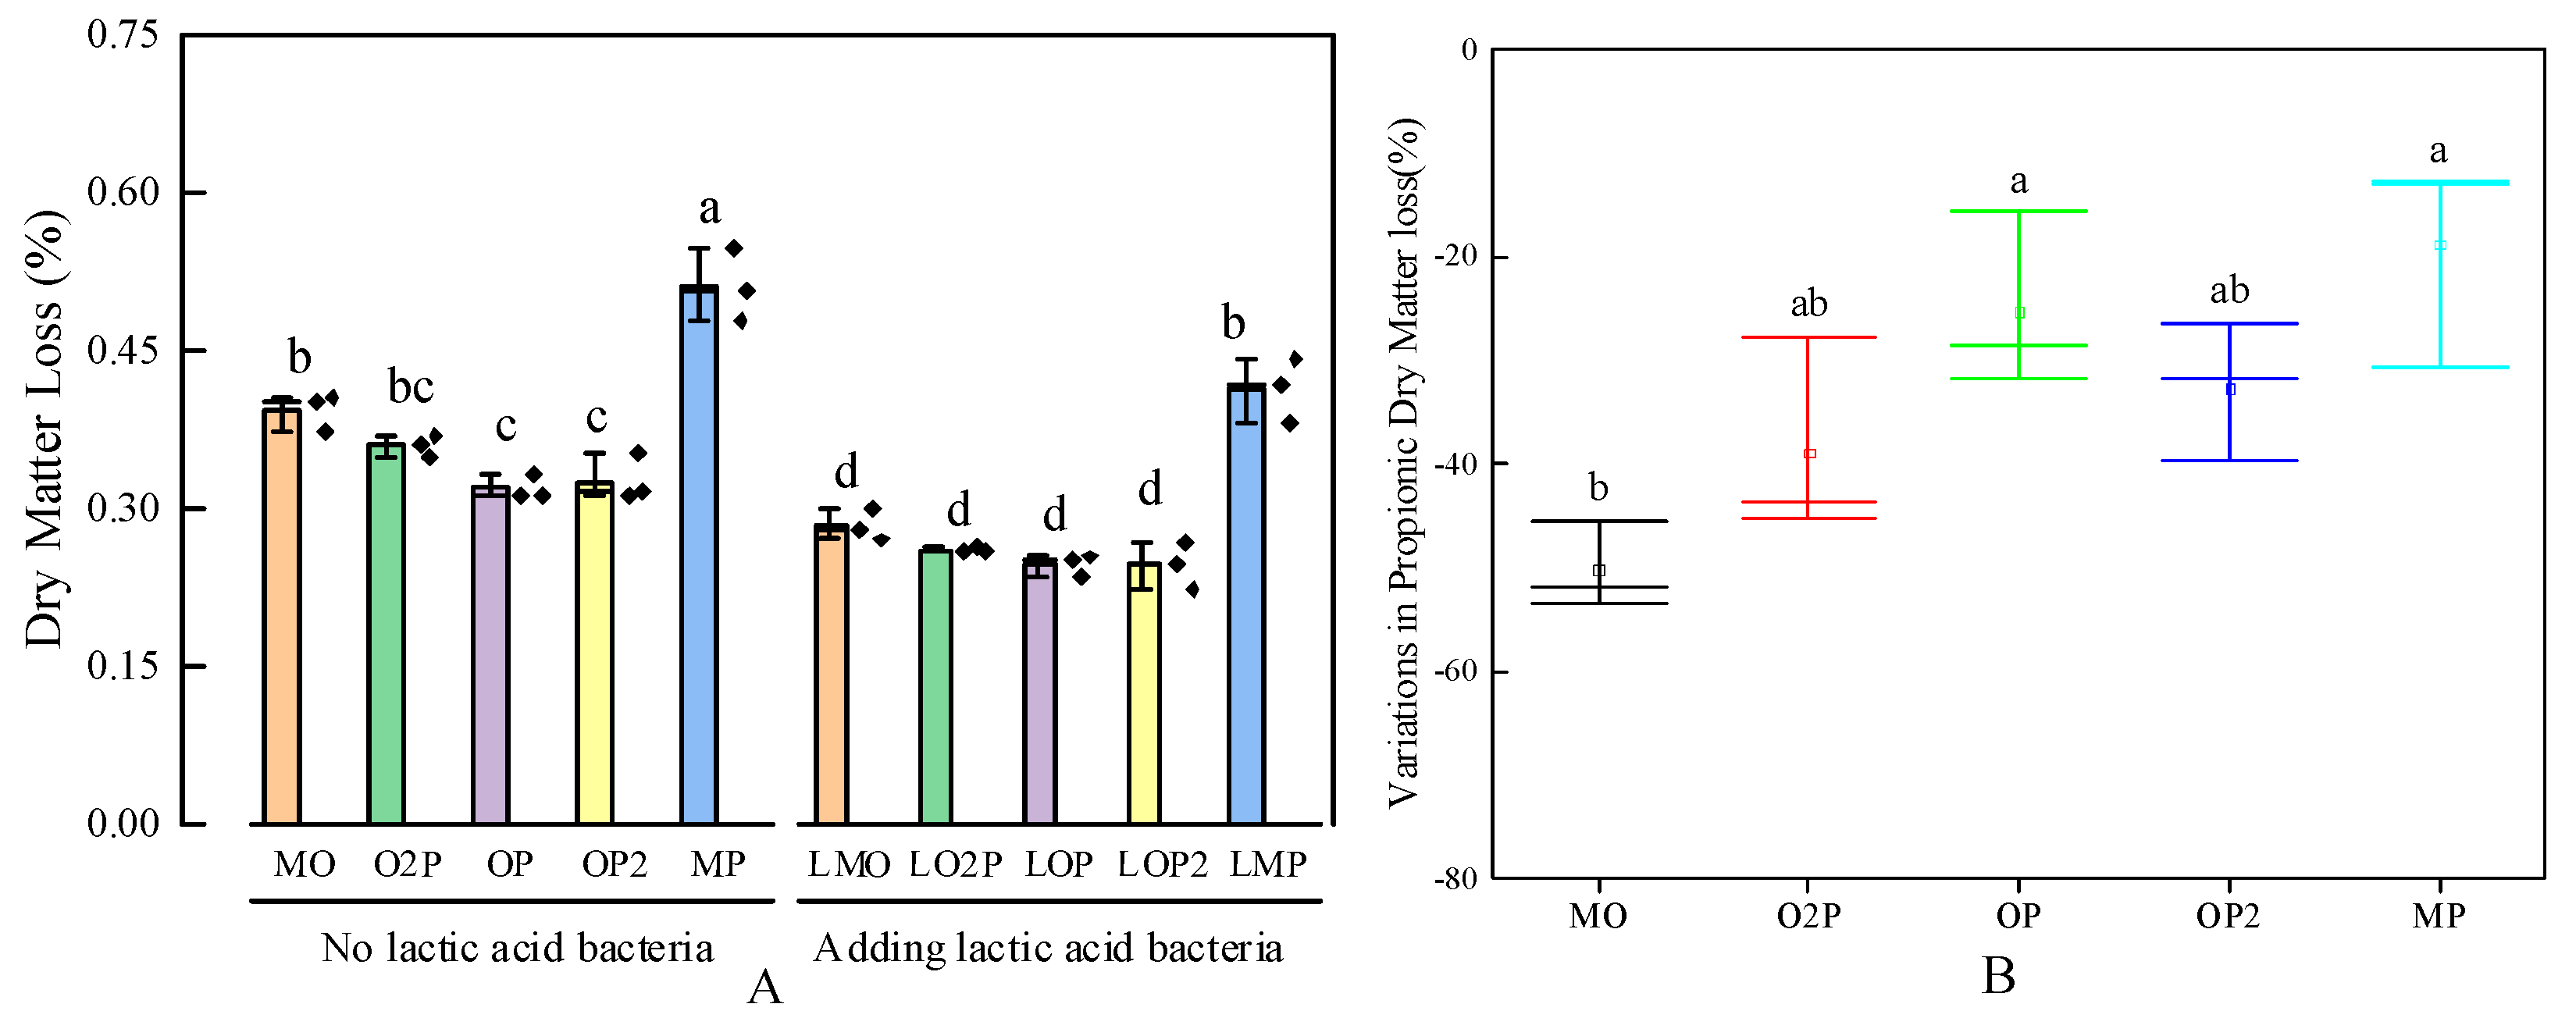
Effect of different mixed cropping ratios of oats and peas and lactic acid bacteria (LAB) additives on the ratio of dry matter loss (DML) of silage (A) and DML variations in AN/N for that with added LAB compared to that without added LAB at the end of the fermentation (B). Mean values in columns marked with the same letters do not differ significantly (p < 0.05). MO, O2P, OP, OP2, and MP represent oat–pea mixed cropping ratios of 1:0, 2:1, 1:1, 1:2, and 0:1, and the series is the silage treatment without lactic acid bacteria; the L series is the silage treatment with the addition of lactic acid bacteria (same as below).
Figure 14.
Effect of different mixed cropping ratios of oats and peas and lactic acid bacteria (LAB) additives on the ratio of dry matter loss (DML) of silage (A) and DML variations in AN/N for that with added LAB compared to that without added LAB at the end of the fermentation (B). Mean values in columns marked with the same letters do not differ significantly (p < 0.05). MO, O2P, OP, OP2, and MP represent oat–pea mixed cropping ratios of 1:0, 2:1, 1:1, 1:2, and 0:1, and the series is the silage treatment without lactic acid bacteria; the L series is the silage treatment with the addition of lactic acid bacteria (same as below).
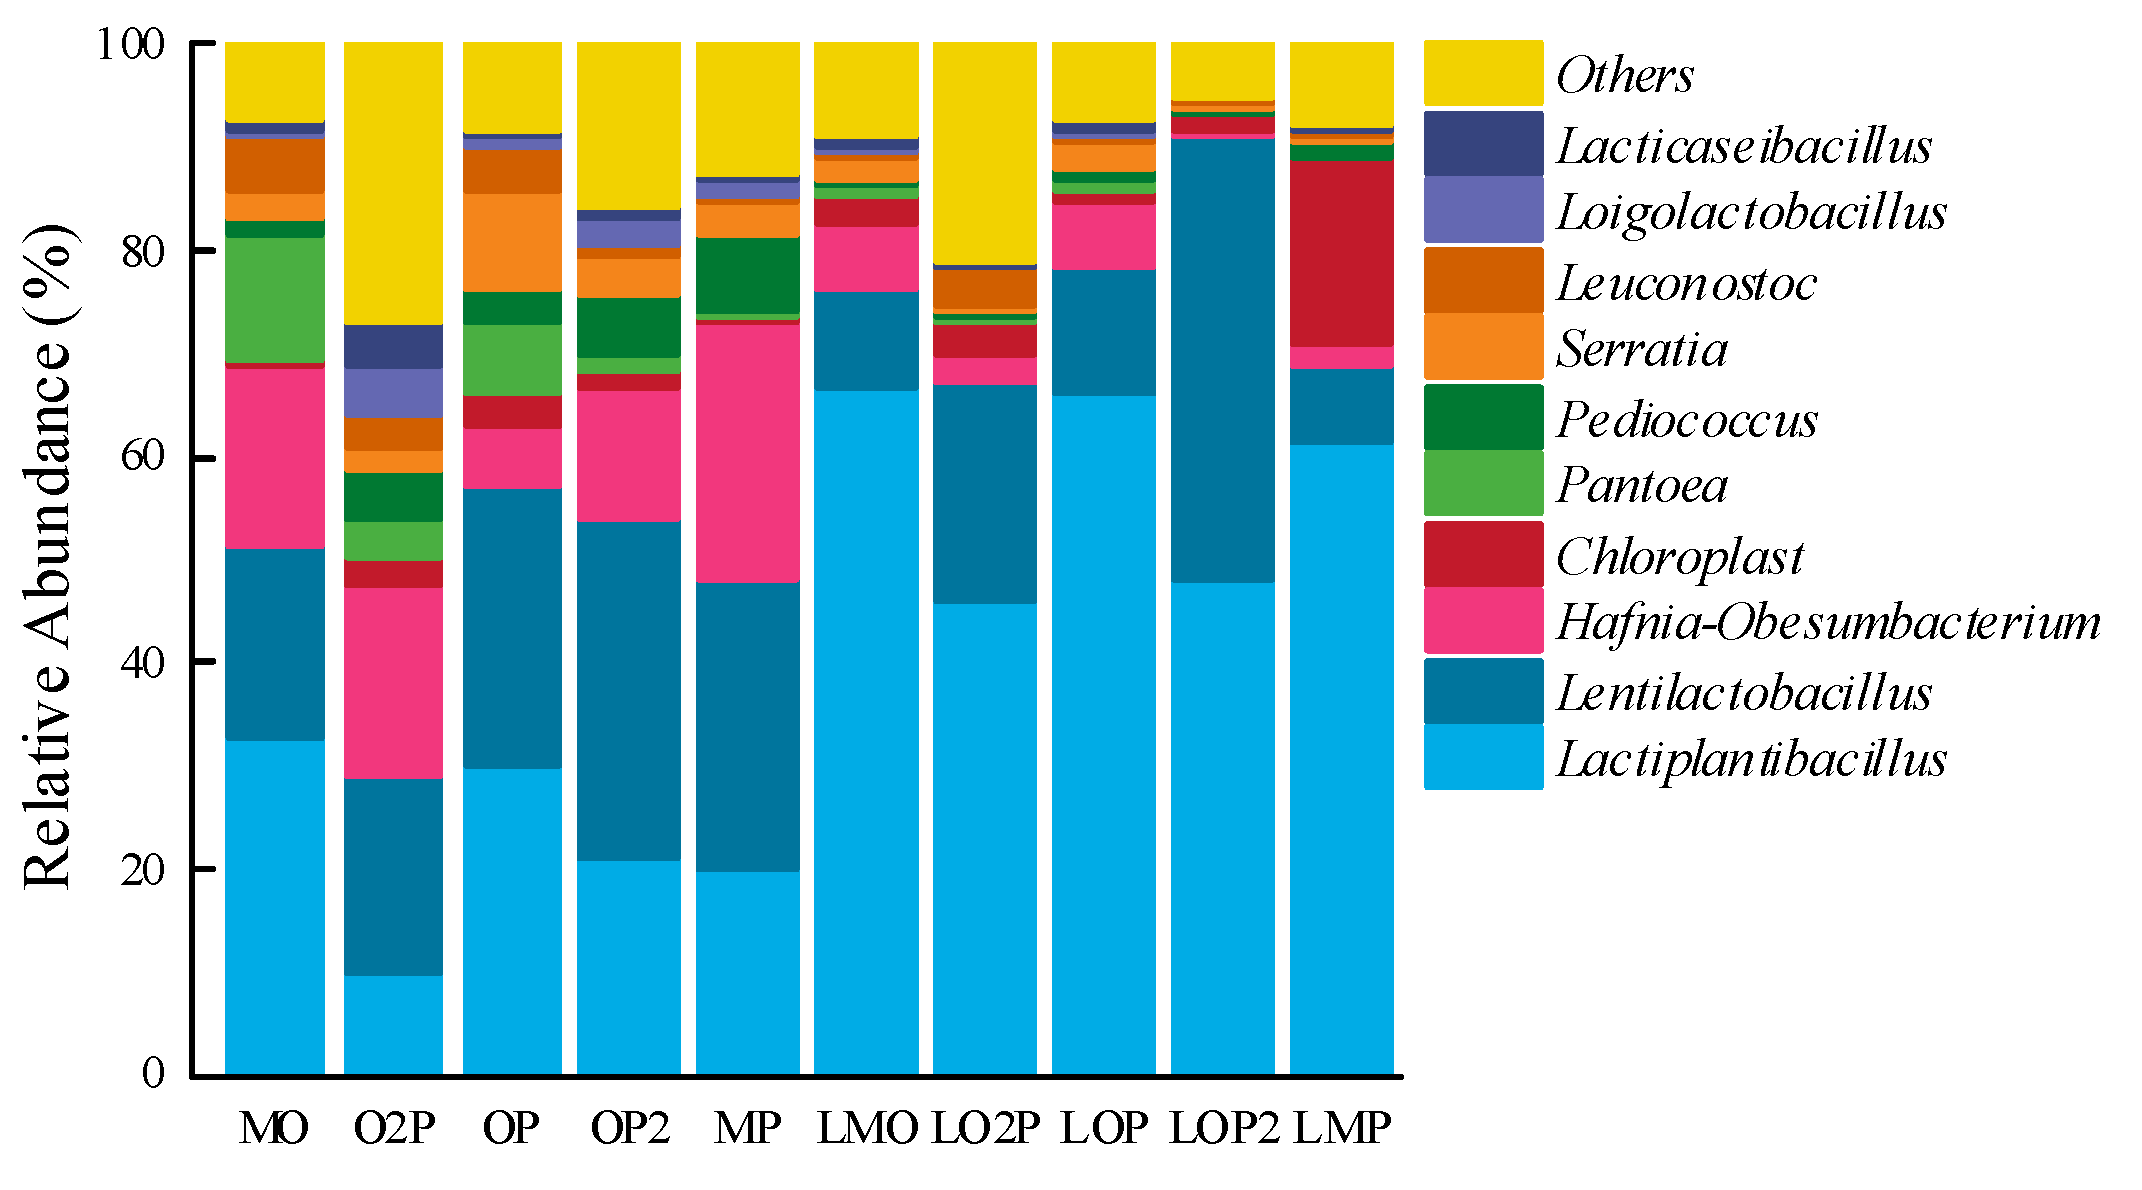
Effect of different mixed cropping ratios of oats and peas and lactic acid bacteria (LAB) additives on the relative abundances of the microbial communities in silage at the genus level of silage.
Figure 15.
Effect of different mixed cropping ratios of oats and peas and lactic acid bacteria (LAB) additives on the relative abundances of the microbial communities in silage at the genus level of silage.
Weight distribution of each indicator.
Figure 16.
Weight distribution of each indicator.
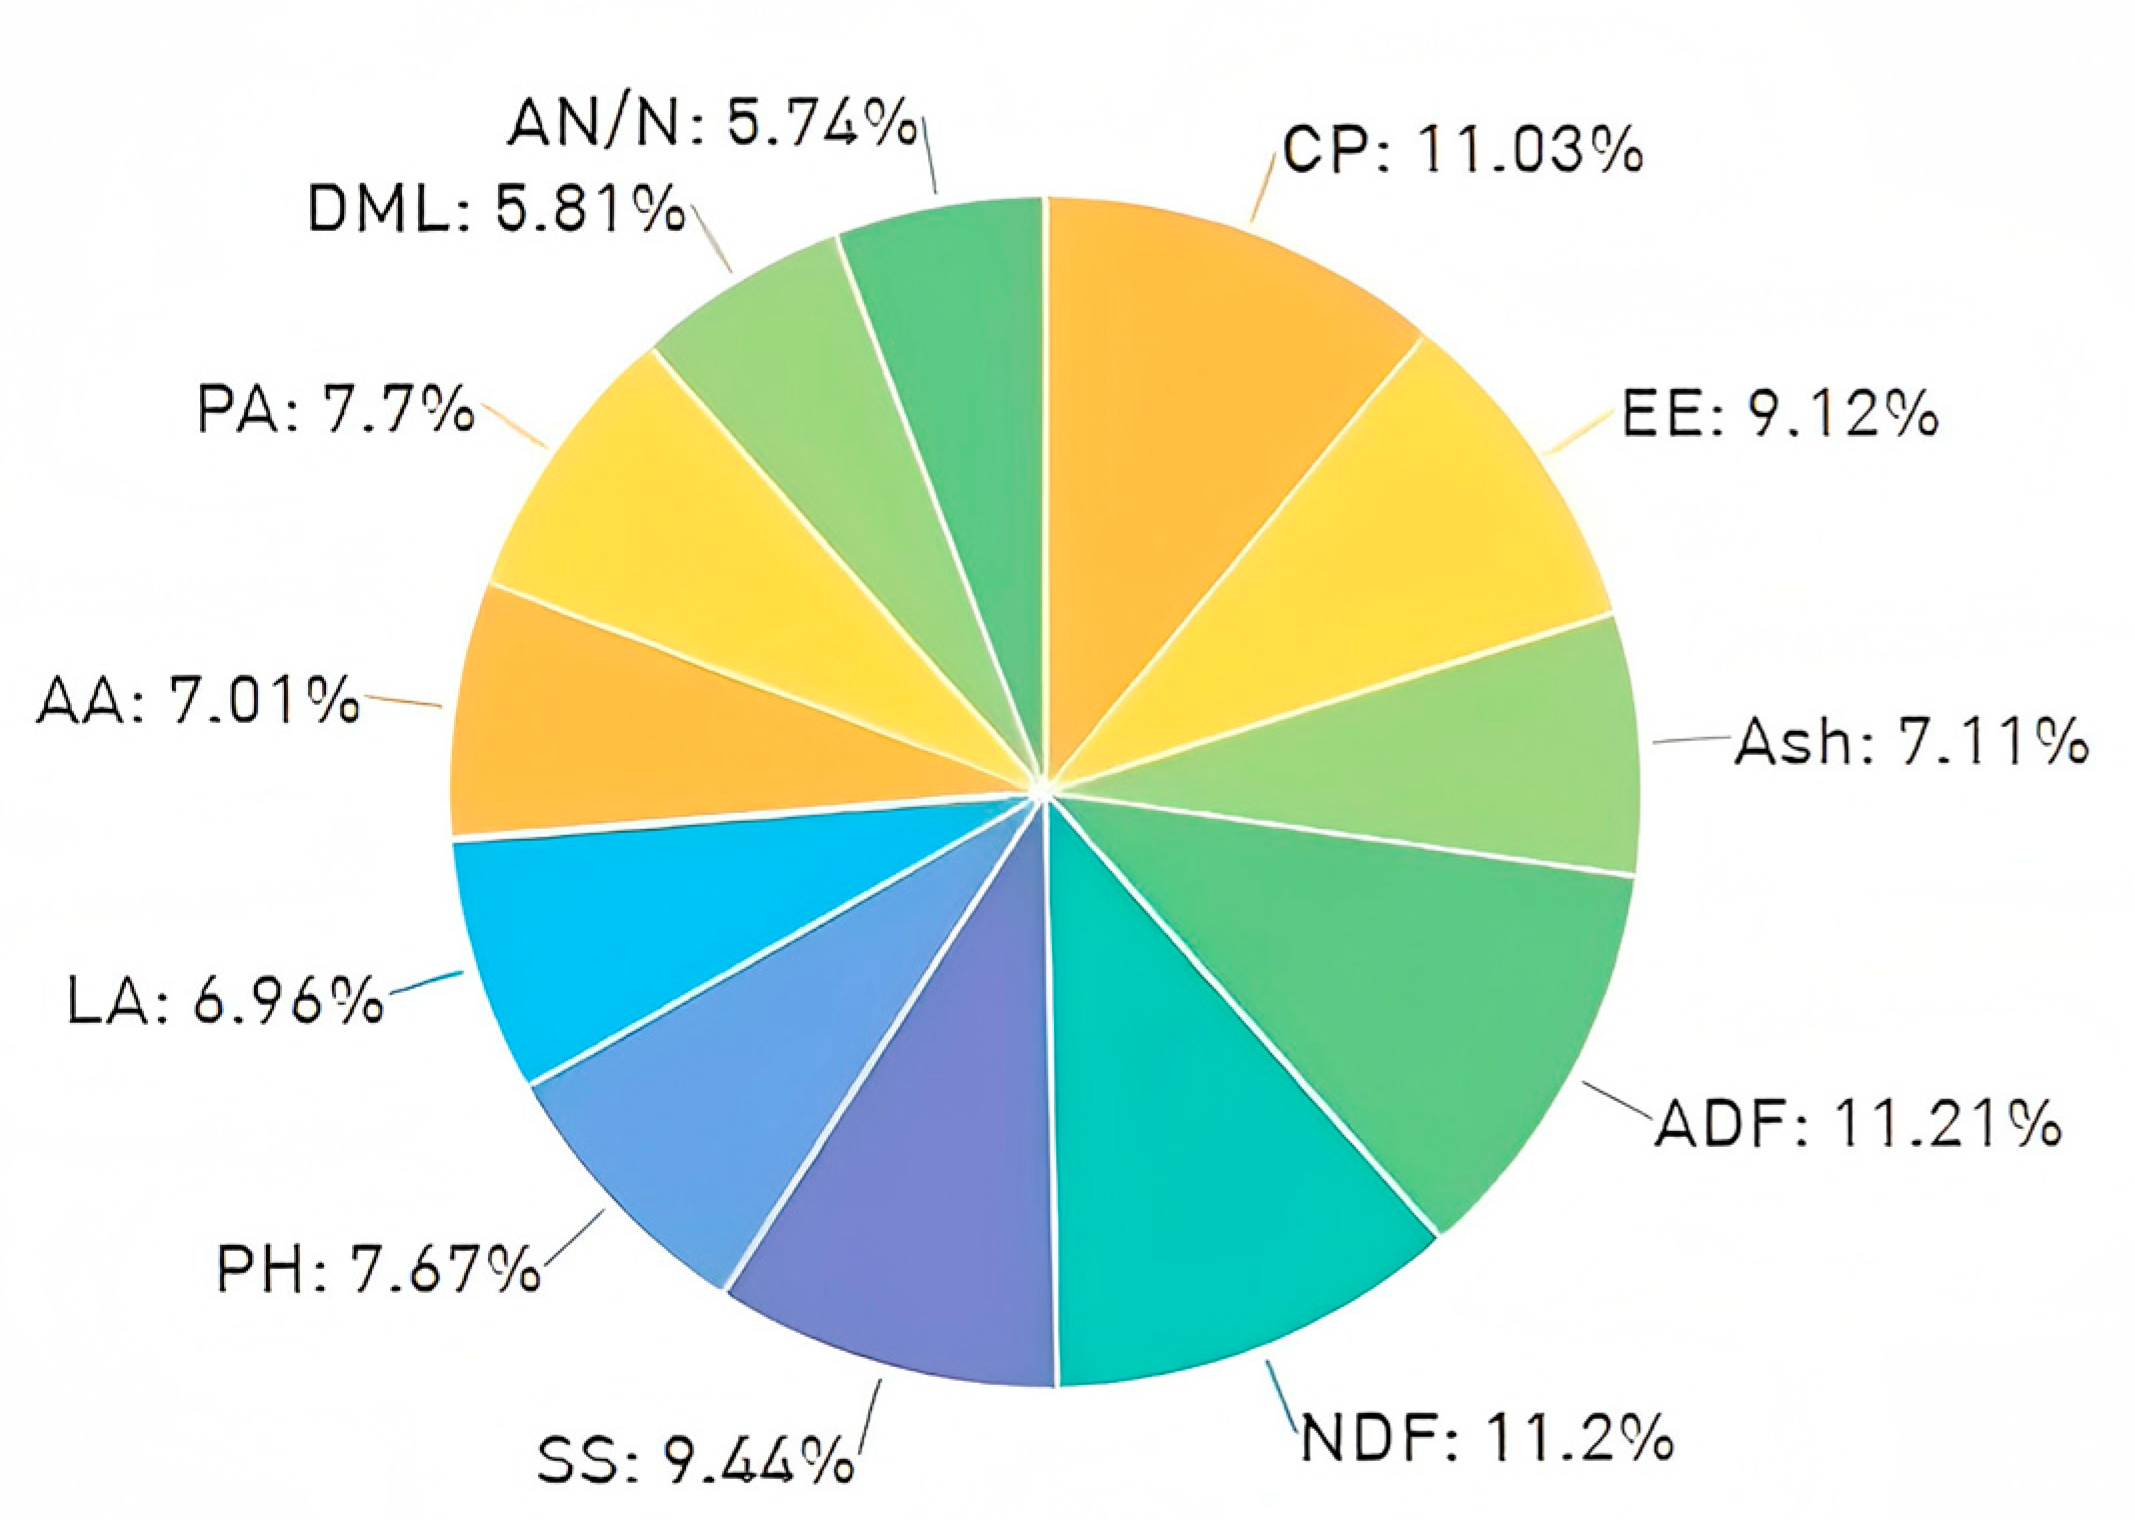
Table 1.
Mixed cropping ratio and sowing amount of oats and peas used in this study.
Table 1.
Mixed cropping ratio and sowing amount of oats and peas used in this study.
| Code | Mixed Cropping Ratio | Seeding Rate (kg·ha−1) | |
|---|---|---|---|
| Oat | Pea | ||
| MO | 1:0 | 187.5 | 0 |
| O2P | 2:1 | 125 | 40 |
| OP | 1:1 | 93.75 | 60 |
| OP2 | 1:2 | 62.5 | 80 |
| MP | 0:1 | 0 | 120 |
Table 2.
Nutritional quality of mixed cropping oats and peas used in this study as raw materials.
Table 2.
Nutritional quality of mixed cropping oats and peas used in this study as raw materials.
| Crude Protein Content (%DM) | Ether Extract Content (%DM) | Neutral Detergent Fiber Content (%DM) | Acidic Detergent Fiber Content (%DM) | Ash Content (%DM) | |
|---|---|---|---|---|---|
| MO | 8.08 | 2.15 | 52.54 | 28.84 | 10.47 |
| O2P | 9.42 | 2.69 | 51.42 | 27.72 | 9.74 |
| OP | 9.98 | 3.37 | 47.51 | 25.75 | 8.16 |
| OP2 | 10.64 | 3.63 | 45.88 | 25.41 | 8.66 |
| MP | 13.86 | 4.04 | 37.61 | 22.05 | 9.02 |
Sensory scoring criteria for silage quality [22].
Sensory scoring criteria for silage quality [22].
| Sensory Indicators | Scoring Criteria | Score | |||
|---|---|---|---|---|---|
| Odor | Strong but uric acid or ammonia odor, almost no acid. | 2 | |||
| Thick but uric acid odor, pungent burnt odor, or musty odor. | 4 | ||||
| Faint but uric acid odor, or strong acidity, weak aroma. | 10 | ||||
| Strong or distinct bread aroma or distinct bread aroma, no but uric acid odor. | 14 | ||||
| Structure | Stem and leaf rotted or seriously contaminated. | 0 | |||
| Stem and leaf structure are damaged obviously or slightly contaminated. | 1 | ||||
| Stem and leaf structure are slightly damaged. | 2 | ||||
| Stem and leaf structure are intact and clearly visible. | 4 | ||||
| Color | Severe discoloration, dark green or brown. | 0 | |||
| Slight discoloration, light yellow or green and yellow. | 1 | ||||
| Close to raw material color, light brown after drying. | 2 | ||||
| Total score | 16~20 | 10~15 | 5~9 | 0~4 | |
| Grade | Grade 1 (Excellent) | Grade 2 (Good) | Grade 3 (Medium) | Grade 4 (Rotten) | |
Table 4.
The effect of different mixed cropping ratios of oats and peas and lactic acid bacteria (LAB) additives on the sensory quality of silage.
Table 4.
The effect of different mixed cropping ratios of oats and peas and lactic acid bacteria (LAB) additives on the sensory quality of silage.
| Treatments | Odor | Structure | Color |
|---|---|---|---|
| MO | Stronger acidic flavor | Structural integrity | Brownish |
| O2P | Less aromatic | Structural integrity | Brownish |
| OP | Less aromatic | Slightly damaged | Brownish |
| OP2 | Less aromatic | Slightly damaged | Brownish |
| MP | Strong aromatic flavor | Significant structural damage | Brownish |
| LMO | Stronger acidic flavor | Structural integrity | Brownish |
| LO2P | Less aromatic | Structural integrity | Brownish |
| LOP | Strong aromatic flavor | Structural integrity | Brownish |
| LOP2 | Strong aromatic flavor | Structural integrity | Brownish |
| LMP | Strong aromatic flavor | Significant structural damage | Brownish |
Table 5.
Two-factor ANOVA for fermentation quality.
Table 5.
Two-factor ANOVA for fermentation quality.
| Variation Source | Lactic Acid Bacteria | Mixed Cropping Ratio | Lactic Acid Bacteria × Mixed Cropping Ratio | |||
|---|---|---|---|---|---|---|
| Index | F | p | F | p | F | p |
| PH | 6.139 | 0.002 * | 55.309 | 0.000 ** | 0.222 | 0.923 |
| Lactic Acid (g/kg) | 71.707 | 0.000 ** | 96.52 | 0.000 ** | 0.464 | 0.762 |
| Propionic Acid (g/kg) | 9.142 | 0.000 ** | 19.19 | 0.000 ** | 11.571 | 0.000 ** |
| Acetic Acid (g/kg) | 10.934 | 0.000 ** | 0.607 | 0.445 | 0.611 | 0.66 |
| Butyric Acid | ND | ND | ND | |||
| Dry Matter Loss (%) | 106.893 | 0.000 ** | 223.944 | 0.000 ** | 2.076 | 0.122 |
| AN/N (%) | 668.118 | 0.000 ** | 3146.889 | 0.000 ** | 30.9 | 0.000 ** |
Table 6.
The Grey correlation degree and ranking of the nutritional and fermentation qualities of silage under different mixed cropping ratios of oats rand peas and with LAB additives.
Table 6.
The Grey correlation degree and ranking of the nutritional and fermentation qualities of silage under different mixed cropping ratios of oats rand peas and with LAB additives.
| Treatment | Relatedness | Rankings | Weighted Correlation | Rankings |
|---|---|---|---|---|
| MO | 0.717 | 10 | 0.689 | 10 |
| O2P | 0.746 | 9 | 0.719 | 9 |
| OP | 0.791 | 5 | 0.765 | 6 |
| OP2 | 0.800 | 4 | 0.776 | 5 |
| MP | 0.780 | 7 | 0.779 | 4 |
| LMO | 0.754 | 8 | 0.720 | 8 |
| LO2P | 0.788 | 6 | 0.757 | 7 |
| LOP | 0.844 | 2 | 0.814 | 2 |
| LOP2 | 0.849 | 1 | 0.823 | 1 |
| LMP | 0.800 | 3 | 0.800 | 3 |
Source link
Yuyan Ma www.mdpi.com