
The Interagency Working Group on Ocean and Coastal Mapping (IWG-OCM) released the second annual report on the progress made in mapping U.S. ocean, coastal, and Great Lakes waters. The depth, shape, and composition of the seafloor are foundational data elements that we need to understand in order to explore, sustainably develop, conserve, and manage our coastal and offshore ocean resources. The 2020 National Strategy for Mapping, Exploring, and Characterizing the United States Exclusive Economic Zone and the global Seabed 2030 initiative make comprehensive ocean mapping a priority for the coming decade. The Unmapped U.S. Waters report tracks progress toward these important goals.
Pulling from an analysis of publicly available bathymetry, the report presents the percentage of unmapped U.S. waters by region and shows our progress towards filling these basic bathymetry data gaps with each passing year. At the end of 2020, the latest analysis yielded a 1% gain, equal to 36,000 square nautical miles, of new bathymetry since the last report.
“While we would like to see greater gains each year to meet our collective target of 150,000 square nautical miles annually, this one percent change reflects valuable contributions from government, private sector, philanthropic and academic survey efforts. Sharing mapping data, and coordinating on new acquisitions and technical innovations to make ocean mapping more efficient, are key elements of the strategy to comprehensively map U.S. waters – we welcome all contributors.”
—Ashley Chappell, NOAA’s Integrated Ocean and Coastal Mapping coordinator.
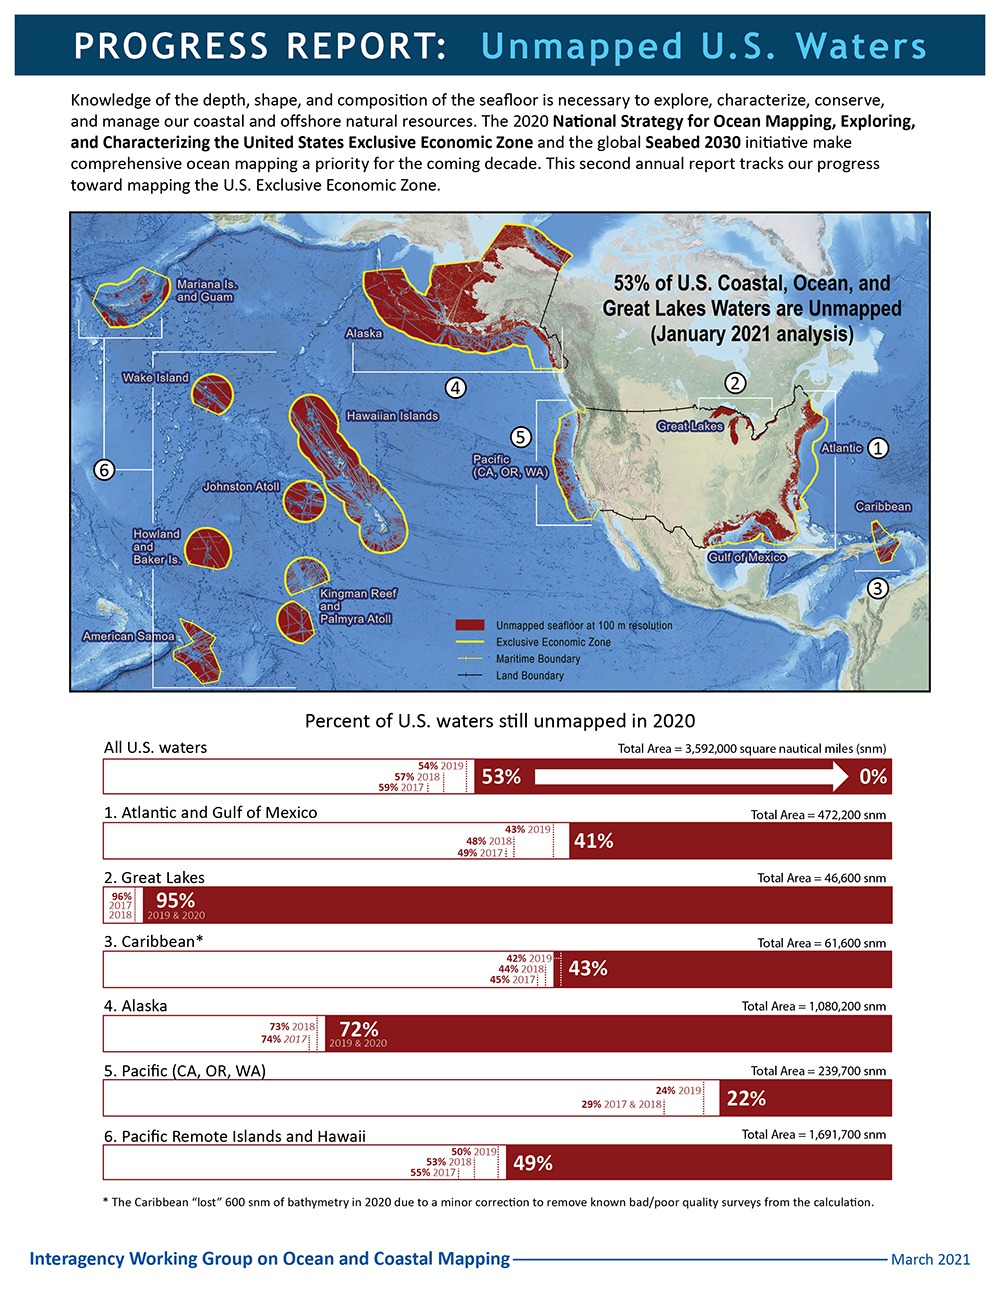
Percent of U.S. waters that remain unmapped as of January 2021:
- U.S. total – 53% of 3,592,000 square nautical miles (snm)
- Atlantic and Gulf of Mexico – 41% of 472,200 snm
- Great Lakes – 95% of 46,600 snm
- Caribbean – 43% of 61,600 snm
- Alaska – 72% of 1,080,200 snm
- Pacific (California, Oregon, Washington) – 22% of 239,700 snm
- Pacific Remote Islands and Hawaii – 49% of 1,691,700 snm
Multibeam and lidar surveys are the two primary sources of bathymetry needed to fill these gaps. In support of the integrated ocean and coastal mapping goal to “map once, use many times,” all of the data collected in this effort are publicly available to benefit numerous users. For the latest status on these efforts and how you can contribute, visit http://iocm.noaa.gov.
Source link
julie.bedford www.noaa.gov