Scheme 1.
Schematic illustration of the fluorescent gold nanoprobes used to detect polarization-associated mRNAs in macrophages.
Figure 1.
(A) TEM images of AuNPs and AuNPs–DNA. Scale bar: 20 nm. (B) UV absorbance of AuNPs–DNA and magnified TEM image of individual AuNPs–DNA. Scale bar: 5 nm. (C) DLS analysis of AuNPs and AuNPs–DNA.

Figure 2.
Detection feasibility of fluorescent mRNA probe. (A,B) Fluorescence emission spectra of the mRNA probe and corresponding quantitative analyses in the presence or absence of the target M1 macrophage. (C,D) Fluorescence emission spectra of fluorescent probe and complementary quantitative studies in the presence or absence of the M2 macrophage CD206 target. Data are expressed as the mean ± SEM (n = 3) (*** p < 0.001).
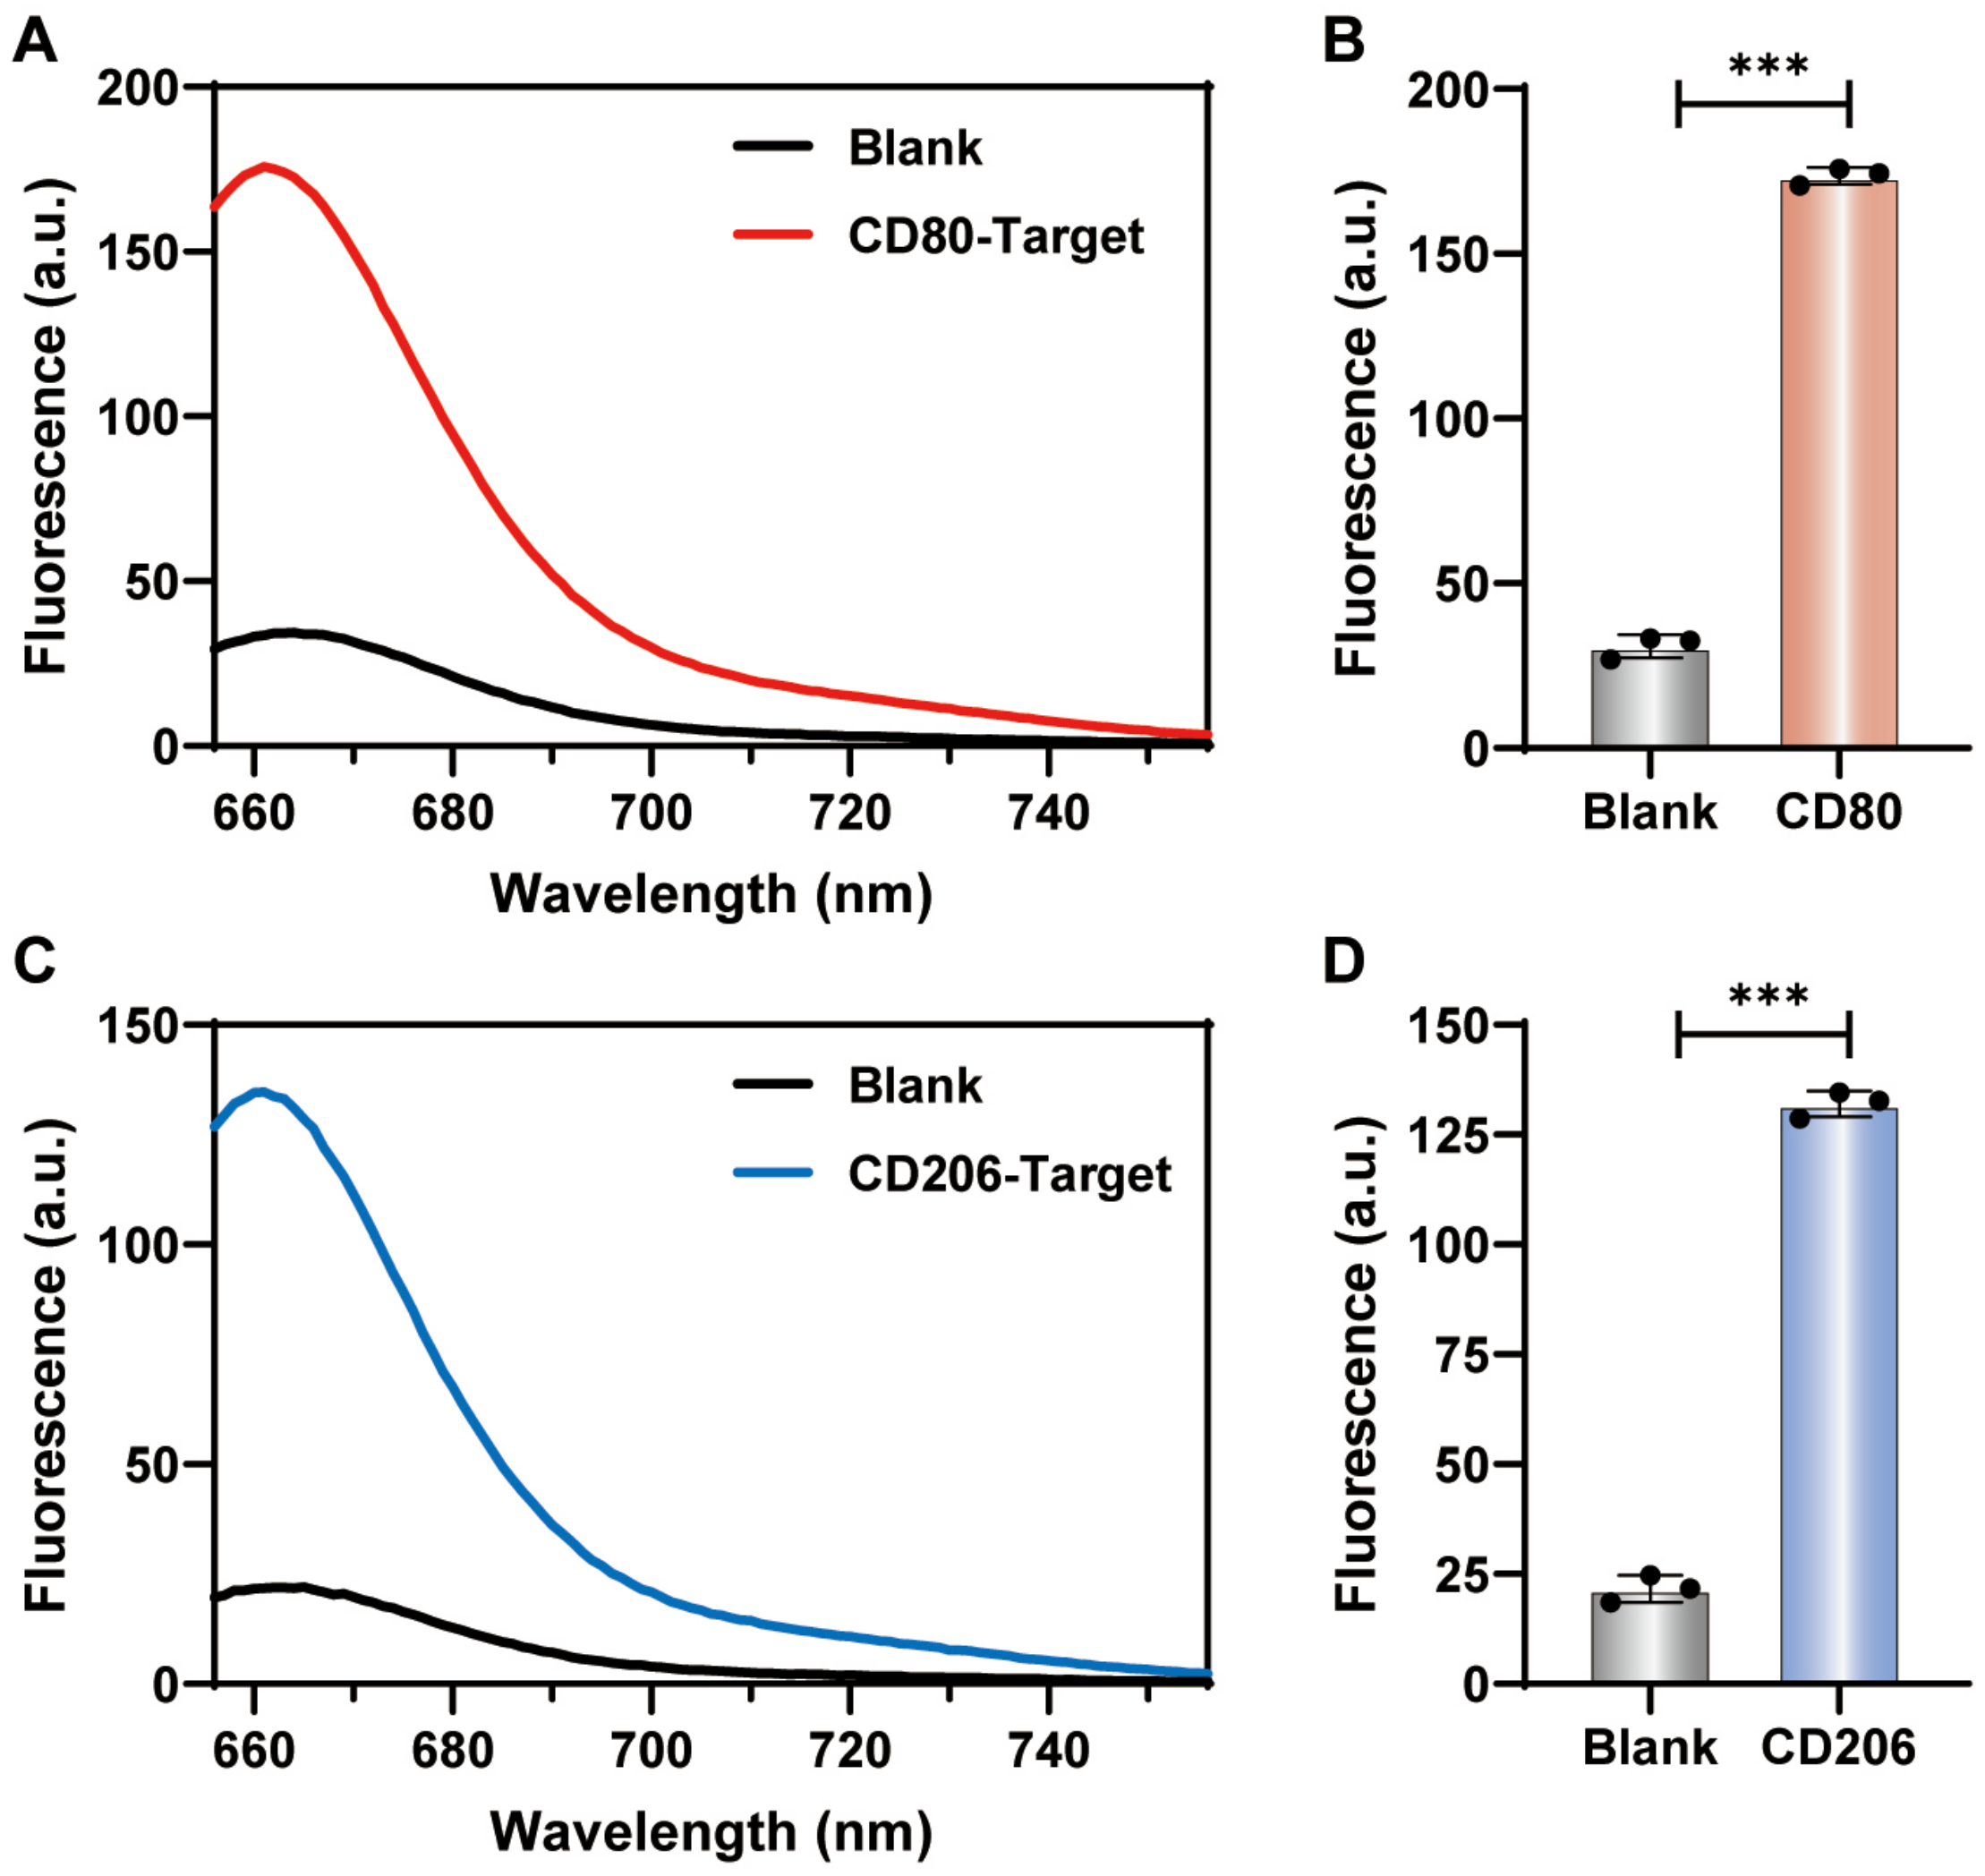
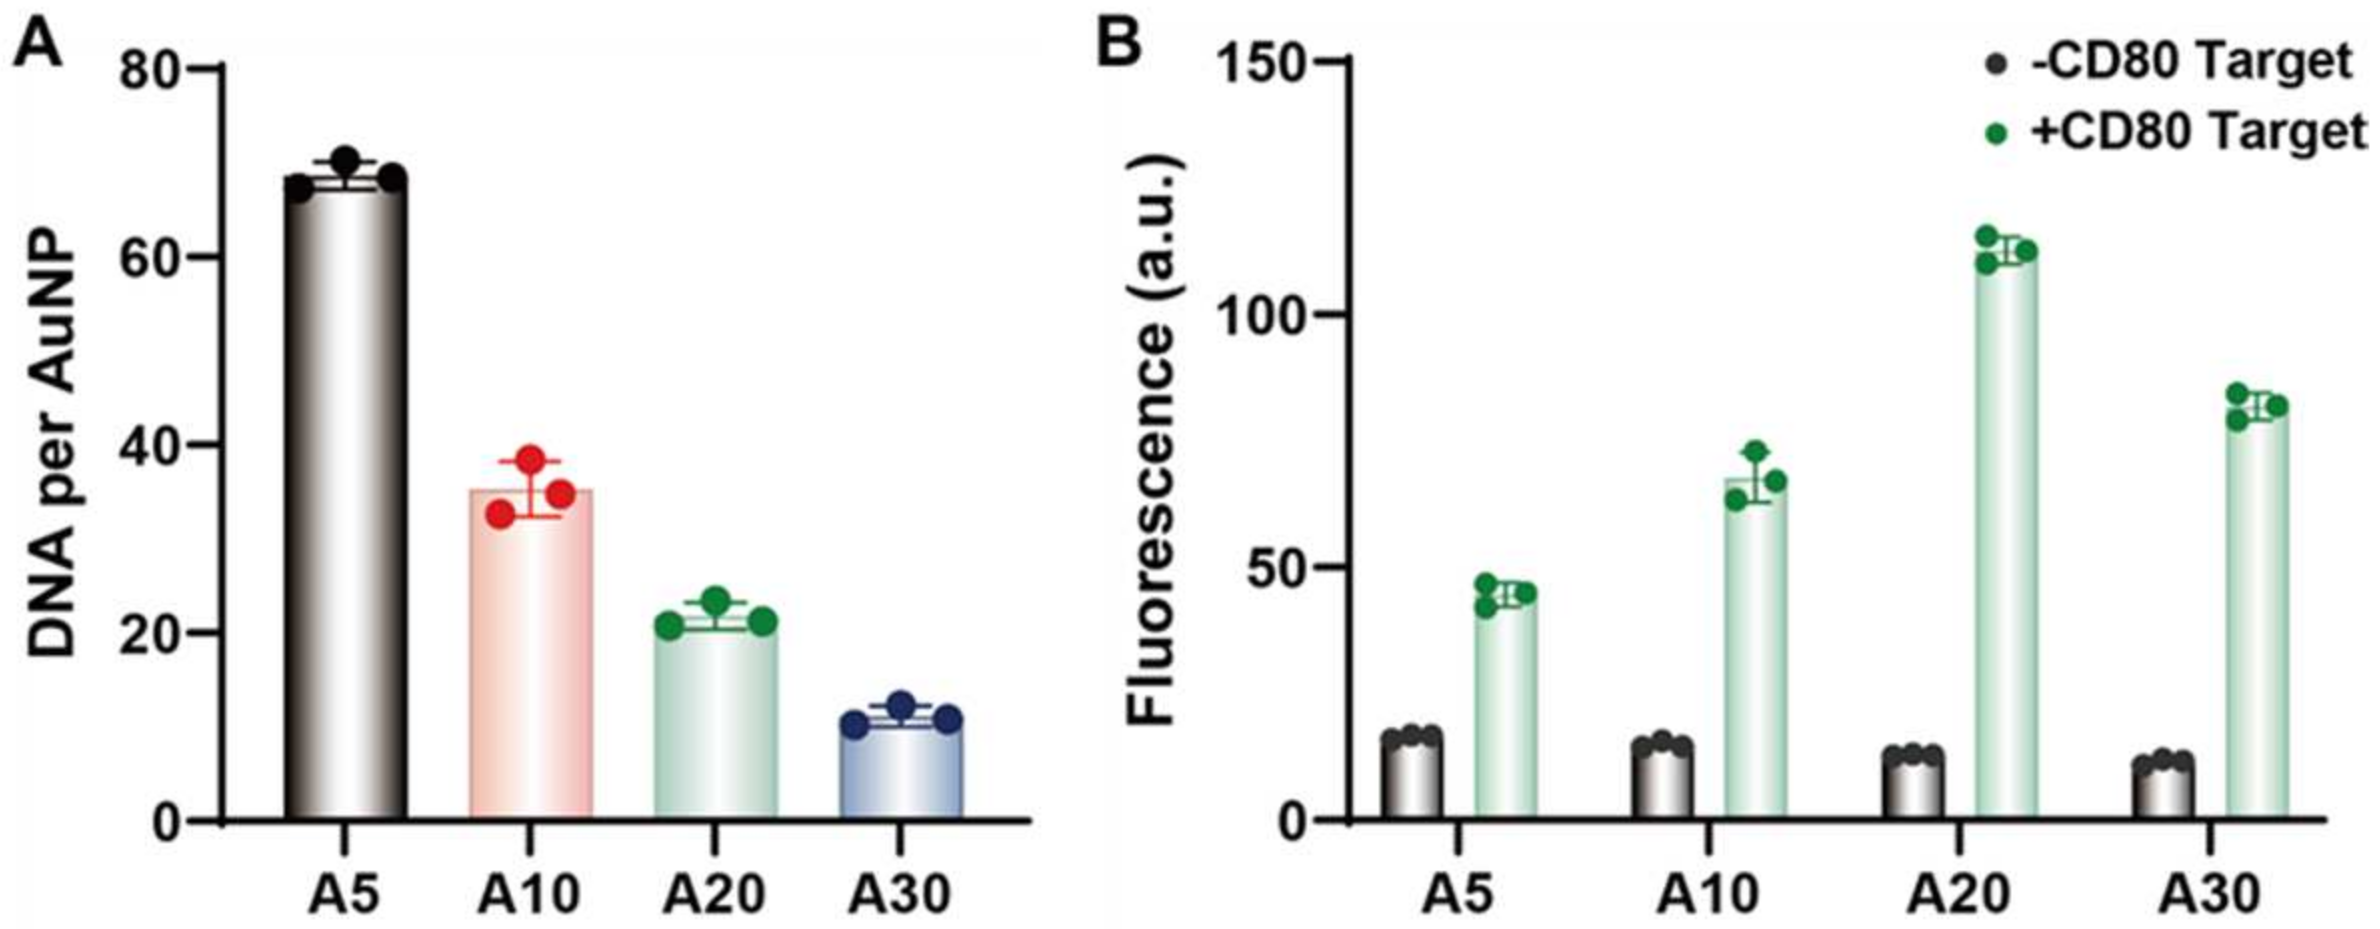
Figure 3.
(A) The loading amount of fluorescent DNA tracks on gold nanoprobes with polyA tails from A5 to A30. (B) The fluorescence of M1-CD80 nanoprobe in the absence and presence of 200 nM CD80 (CD80-T) target sequence at 37 °C for 3 h incubation.
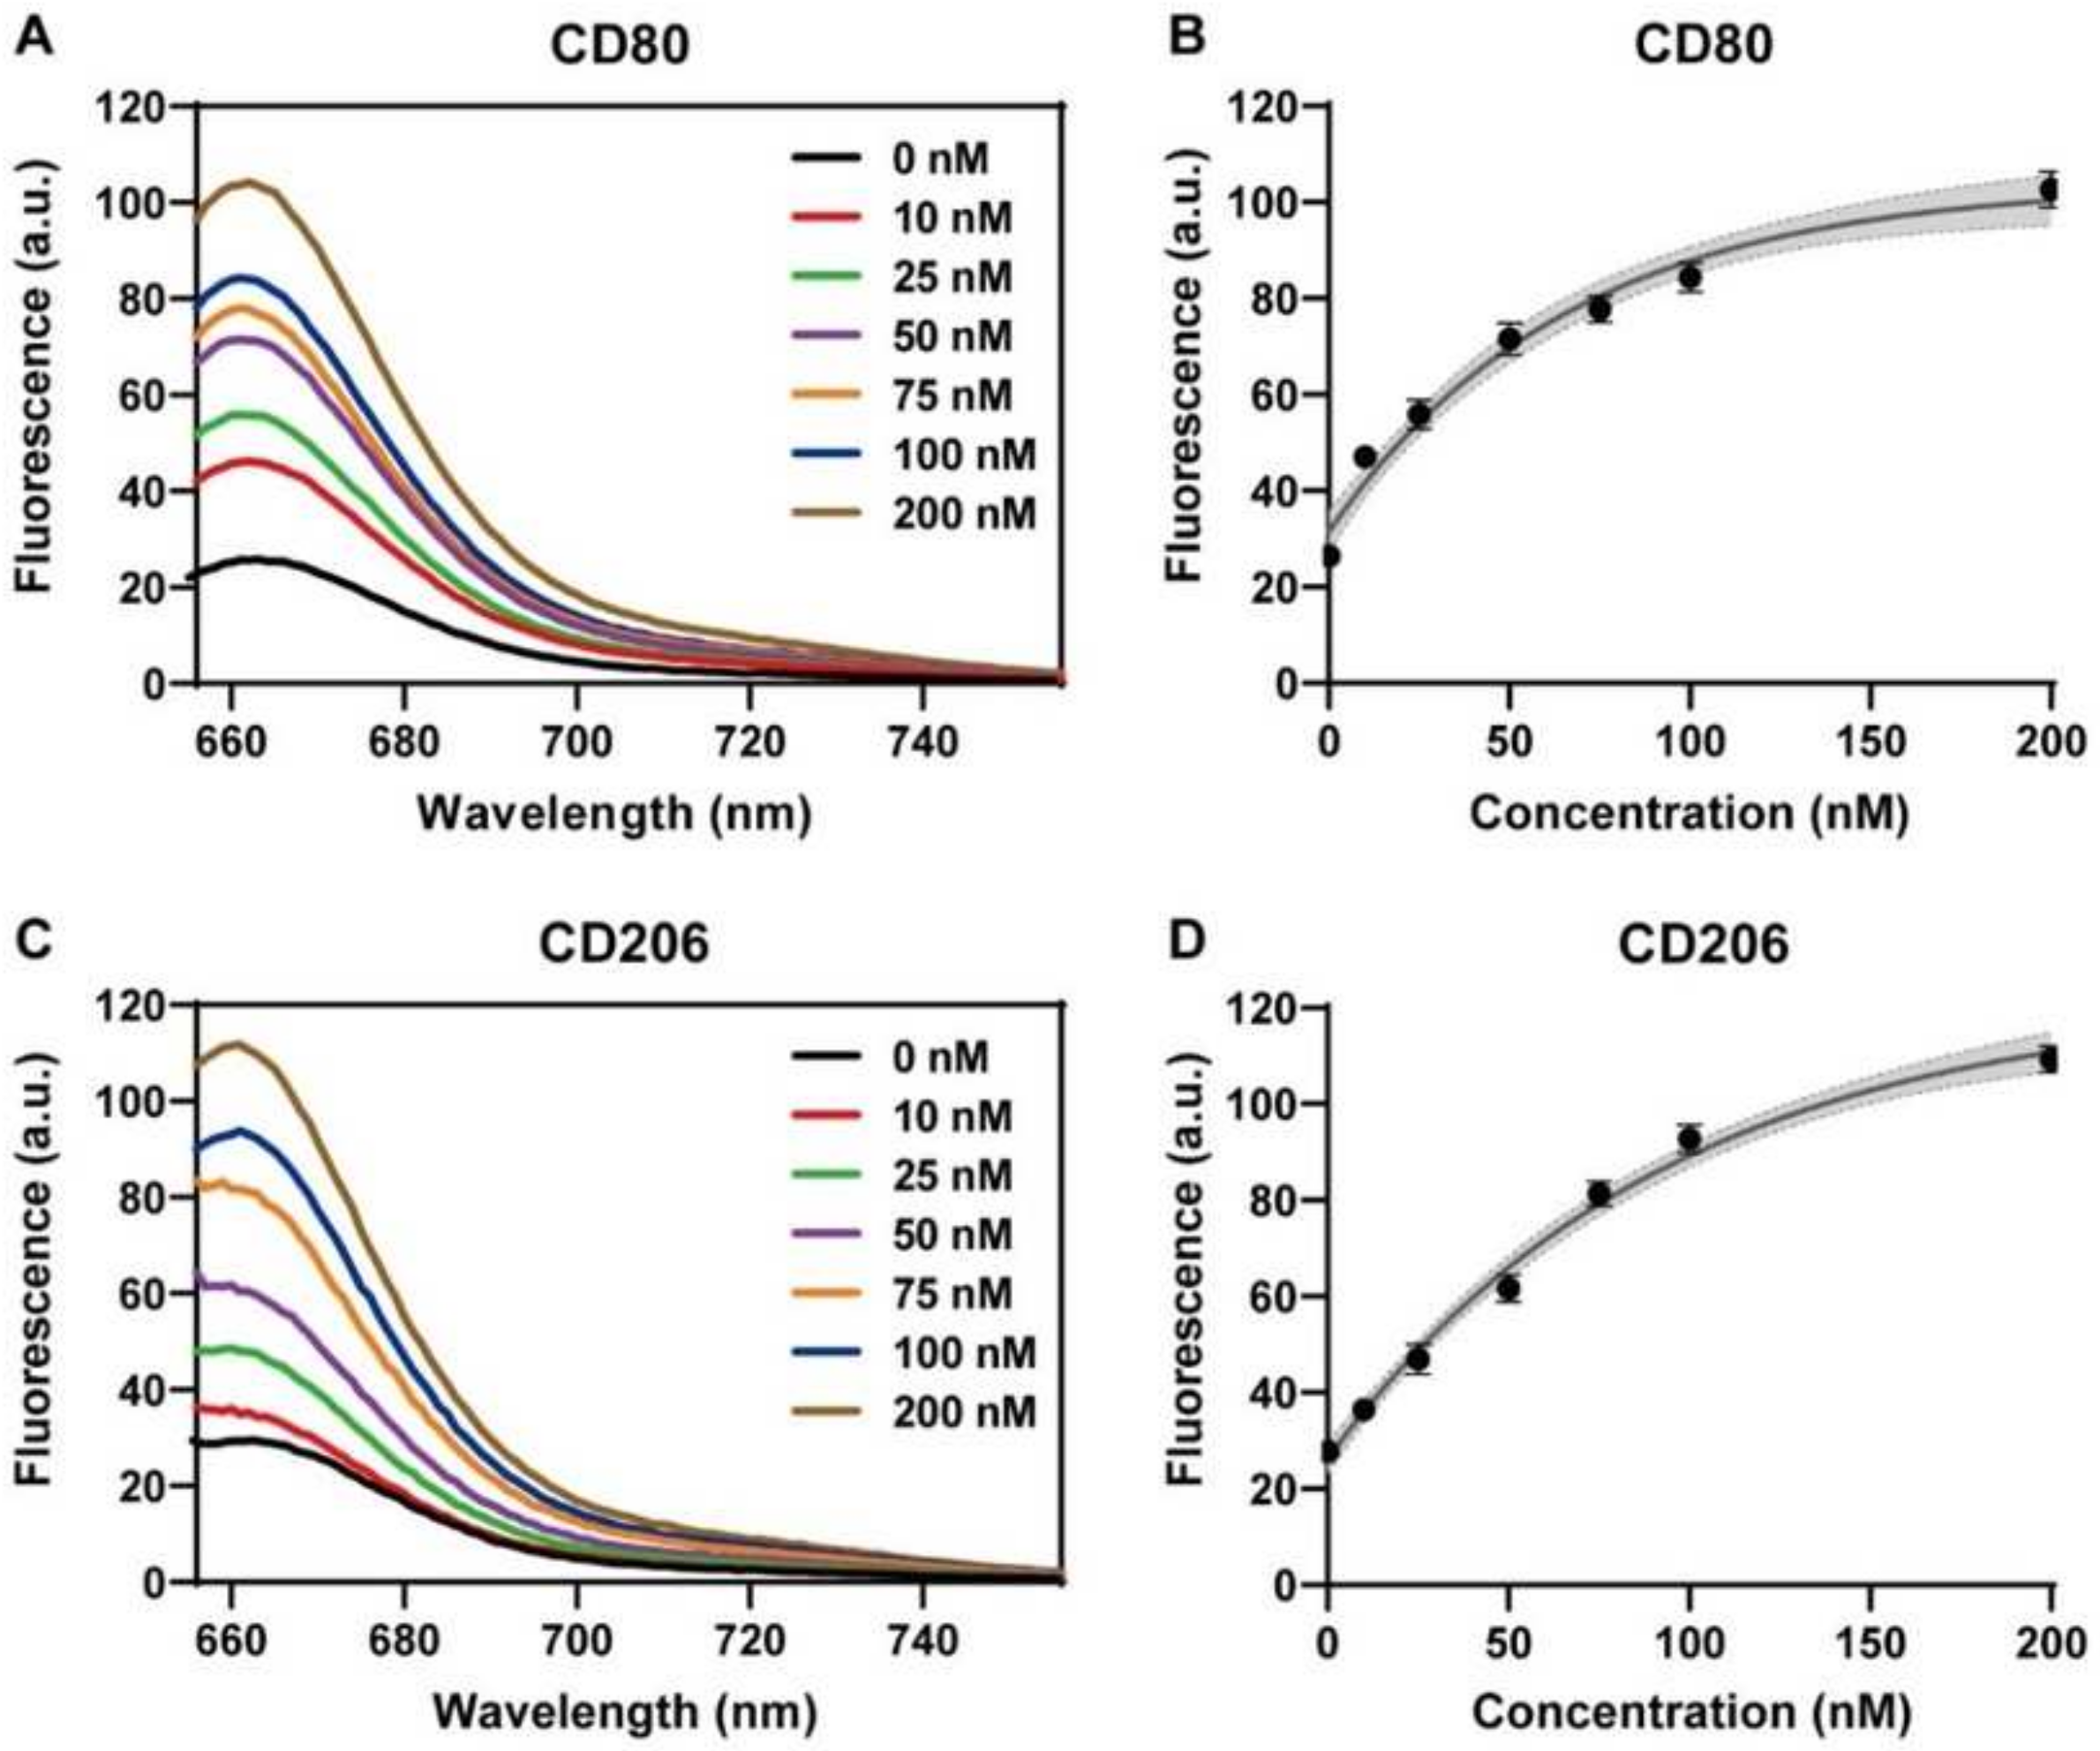
Sensitivity to polyA20-mediated concentration detection of Cy5-labeled fluorescent nanoprobes. (A,B) Fluorescence spectra and corresponding fluorescence intensity-concentration curves under 646 nm excitation after adding the 0–200 nM M1 macrophage CD80-T target sequence. (C,D) Fluorescence spectra and corresponding fluorescence intensity-concentration curves under 646 nm excitation after adding 0–200 nM M2 macrophage CD206-T target sequence. All experiments were repeated more than three times, in which the fluorescence intensity-concentration curves were analyzed by nonlinear regression at a 95% confidence level.
Figure 4.
Sensitivity to polyA20-mediated concentration detection of Cy5-labeled fluorescent nanoprobes. (A,B) Fluorescence spectra and corresponding fluorescence intensity-concentration curves under 646 nm excitation after adding the 0–200 nM M1 macrophage CD80-T target sequence. (C,D) Fluorescence spectra and corresponding fluorescence intensity-concentration curves under 646 nm excitation after adding 0–200 nM M2 macrophage CD206-T target sequence. All experiments were repeated more than three times, in which the fluorescence intensity-concentration curves were analyzed by nonlinear regression at a 95% confidence level.
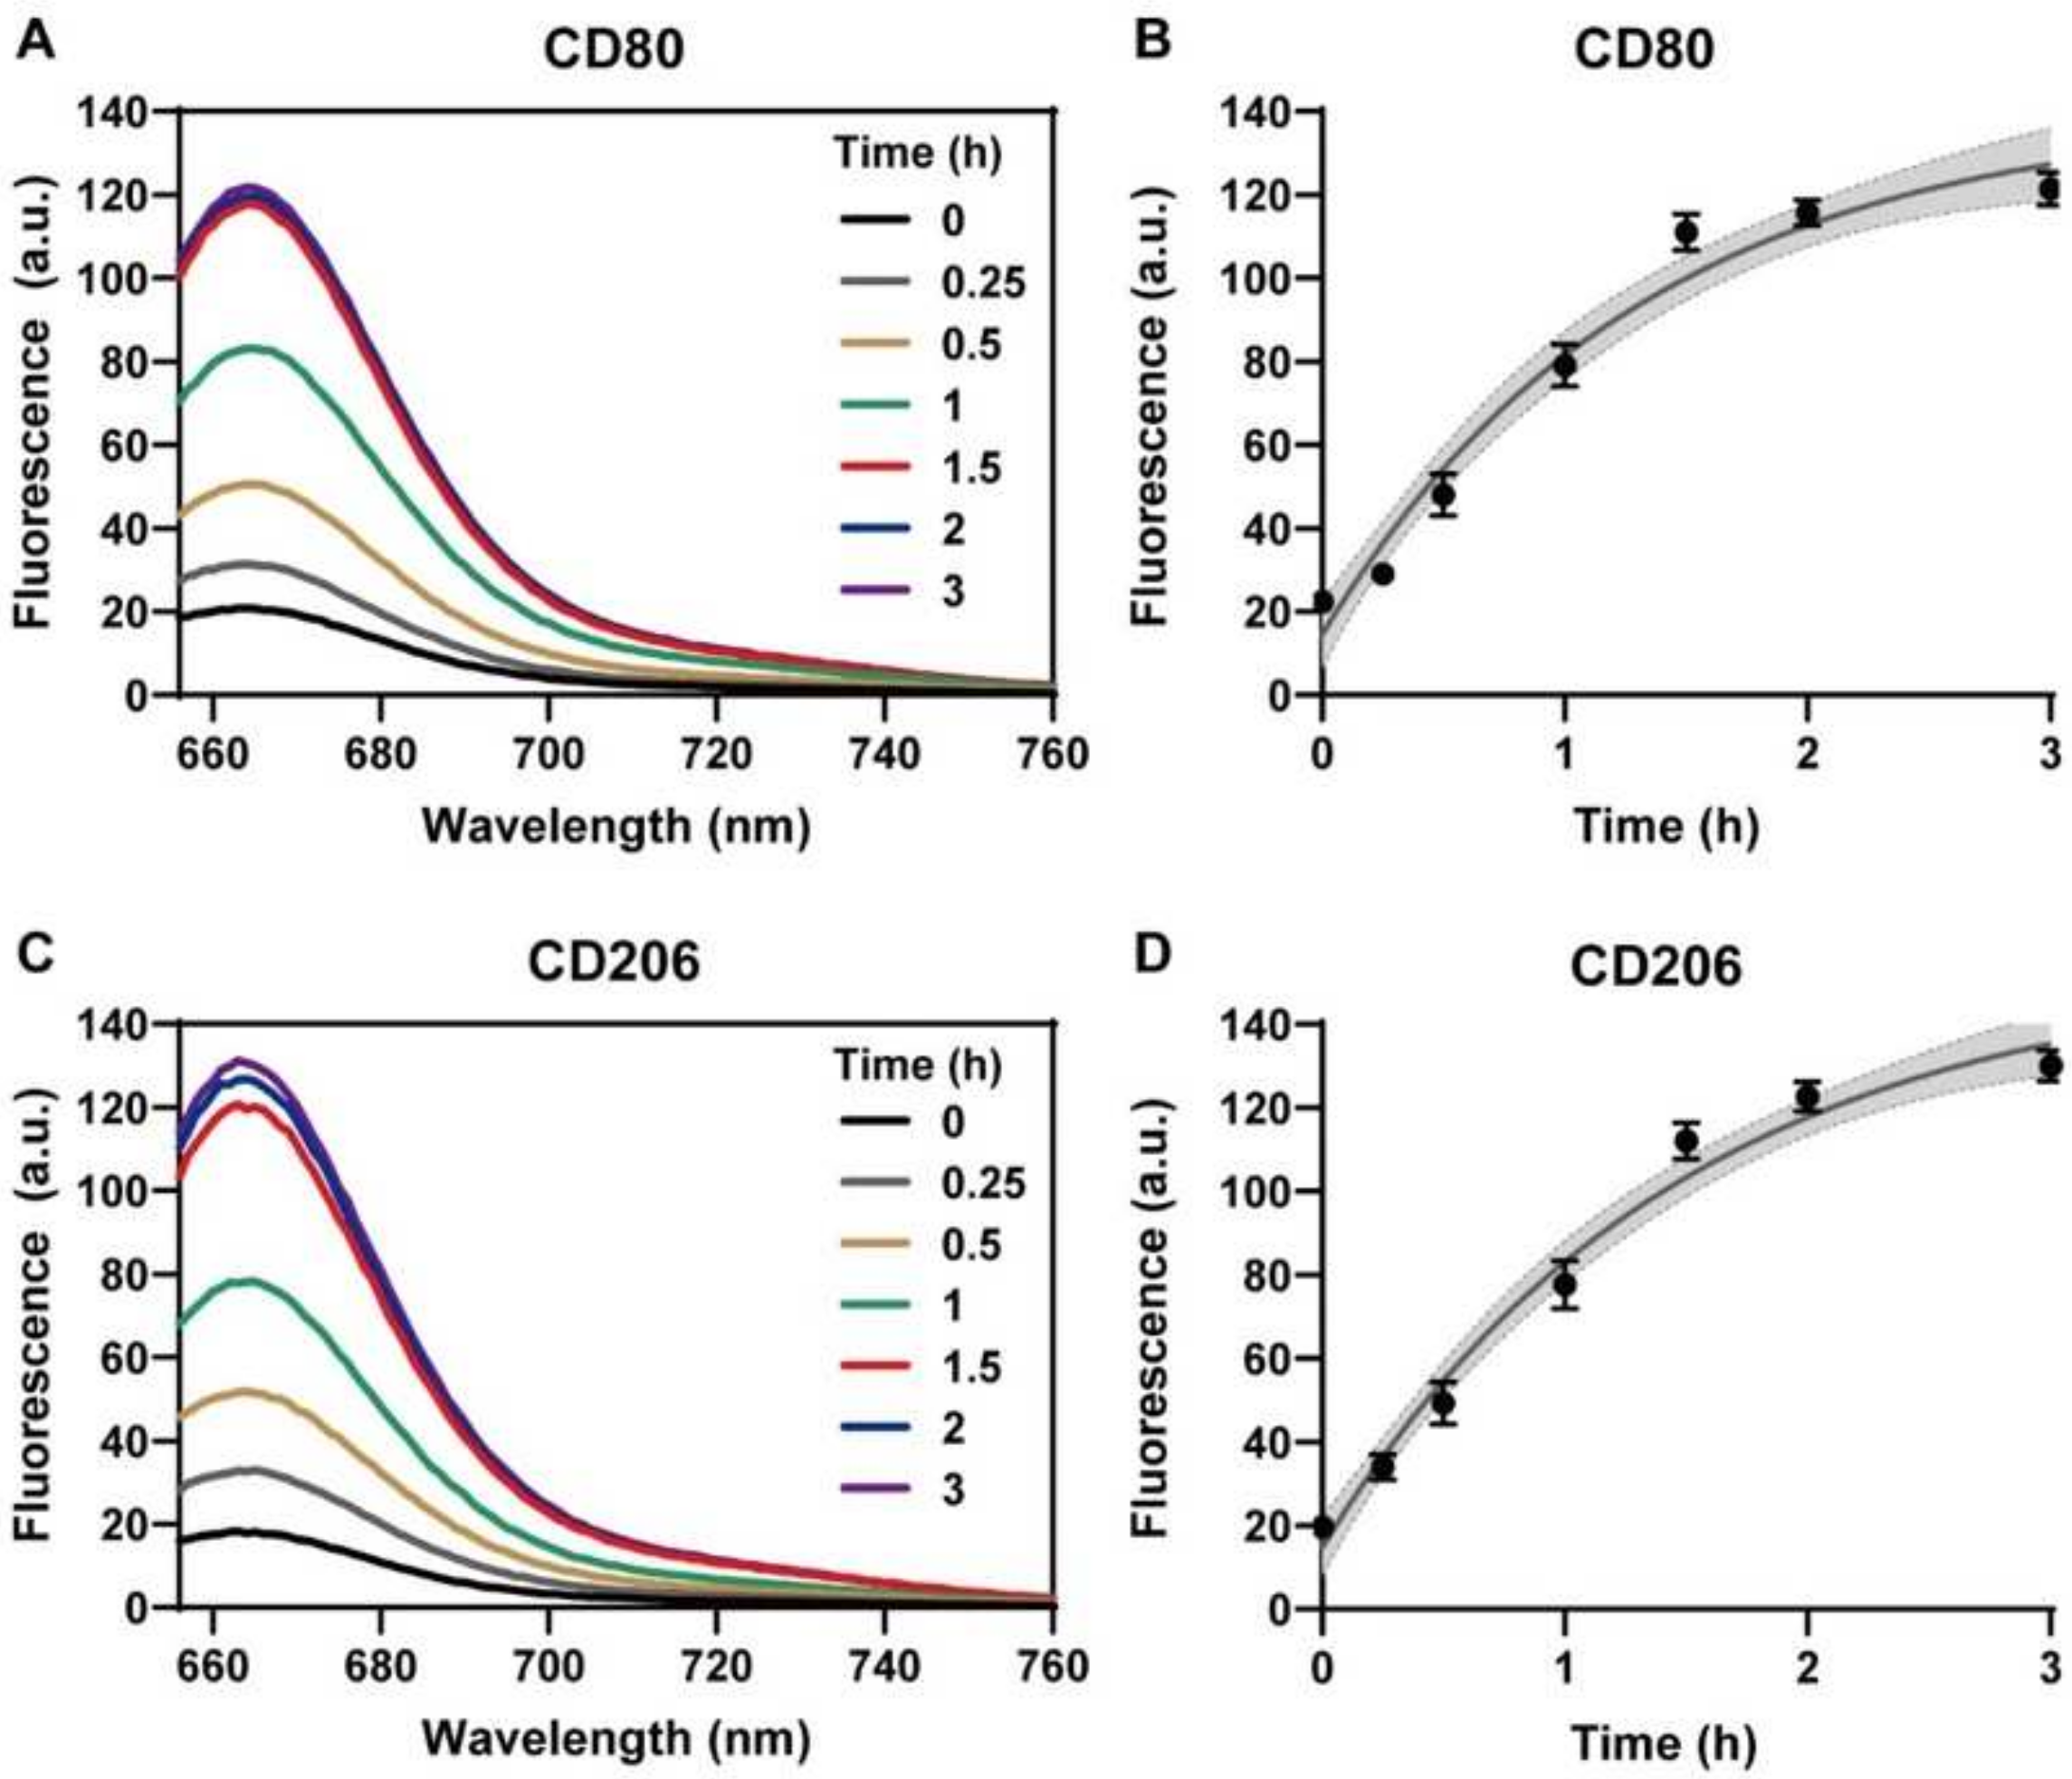
Sensitivity of polyA20-mediated temporal detection of Cy5 fluorescent gold nanoprobes. (A,B) Fluorescence spectra and corresponding fluorescence intensity-time curves under 646 nm excitation after addition of 200 nM M1 macrophage CD80-T target sequences incubated for 0–3 h. (C,D) Fluorescence spectra and corresponding fluorescence intensity-time curves under 646 nm excitation after the addition of 200 nM M2 macrophage CD206-T target sequences incubated for 0–3 h. All experiments were repeated more than three times, in which the fluorescence intensity-time curves were analyzed by nonlinear regression at a 95% confidence level. (C,D) Fluorescence spectra and corresponding fluorescence intensity-time curves after addition of 200 nM M2 macrophage CD206-T target sequence incubated for 0–3 h under 646 nm excitation; all experiments were repeated more than three times, in which the fluorescence intensity-time curves were analyzed by nonlinear regression with a confidence level of 95%.
Figure 5.
Sensitivity of polyA20-mediated temporal detection of Cy5 fluorescent gold nanoprobes. (A,B) Fluorescence spectra and corresponding fluorescence intensity-time curves under 646 nm excitation after addition of 200 nM M1 macrophage CD80-T target sequences incubated for 0–3 h. (C,D) Fluorescence spectra and corresponding fluorescence intensity-time curves under 646 nm excitation after the addition of 200 nM M2 macrophage CD206-T target sequences incubated for 0–3 h. All experiments were repeated more than three times, in which the fluorescence intensity-time curves were analyzed by nonlinear regression at a 95% confidence level. (C,D) Fluorescence spectra and corresponding fluorescence intensity-time curves after addition of 200 nM M2 macrophage CD206-T target sequence incubated for 0–3 h under 646 nm excitation; all experiments were repeated more than three times, in which the fluorescence intensity-time curves were analyzed by nonlinear regression with a confidence level of 95%.
Detection specificity of Cy5 fluorescent fluorescent nanoprobes. (A,B) M1-CD80 nanoprobe with an equal volume of Tris buffer (Blank no target), 200 nM CD80 (CD80-T) target sequence, 200 nM CD80-Error target single base mismatch sequence, and 200 nM CD206 (CD206-T) sequence. Fluorescence response spectra of Aptamer sequences under 646 nm excitation after incubation for 3 h and the corresponding quantitative results. (C,D) M2-CD206 nanoprobe with an equal volume of Tris buffer (Blank without target), 200 nM CD206 (CD206-T) target sequence, 200 nM CD206-Error target single base mismatch sequence. The fluorescence response spectra of 200 nM CD80 (CD80-T) and Aptamer sequences under 646 nm excitation after incubation for 3 h. All experiments were repeated three times. Data are expressed as the mean ± SEM (n = 3) (*** p < 0.001).
Figure 6.
Detection specificity of Cy5 fluorescent fluorescent nanoprobes. (A,B) M1-CD80 nanoprobe with an equal volume of Tris buffer (Blank no target), 200 nM CD80 (CD80-T) target sequence, 200 nM CD80-Error target single base mismatch sequence, and 200 nM CD206 (CD206-T) sequence. Fluorescence response spectra of Aptamer sequences under 646 nm excitation after incubation for 3 h and the corresponding quantitative results. (C,D) M2-CD206 nanoprobe with an equal volume of Tris buffer (Blank without target), 200 nM CD206 (CD206-T) target sequence, 200 nM CD206-Error target single base mismatch sequence. The fluorescence response spectra of 200 nM CD80 (CD80-T) and Aptamer sequences under 646 nm excitation after incubation for 3 h. All experiments were repeated three times. Data are expressed as the mean ± SEM (n = 3) (*** p < 0.001).
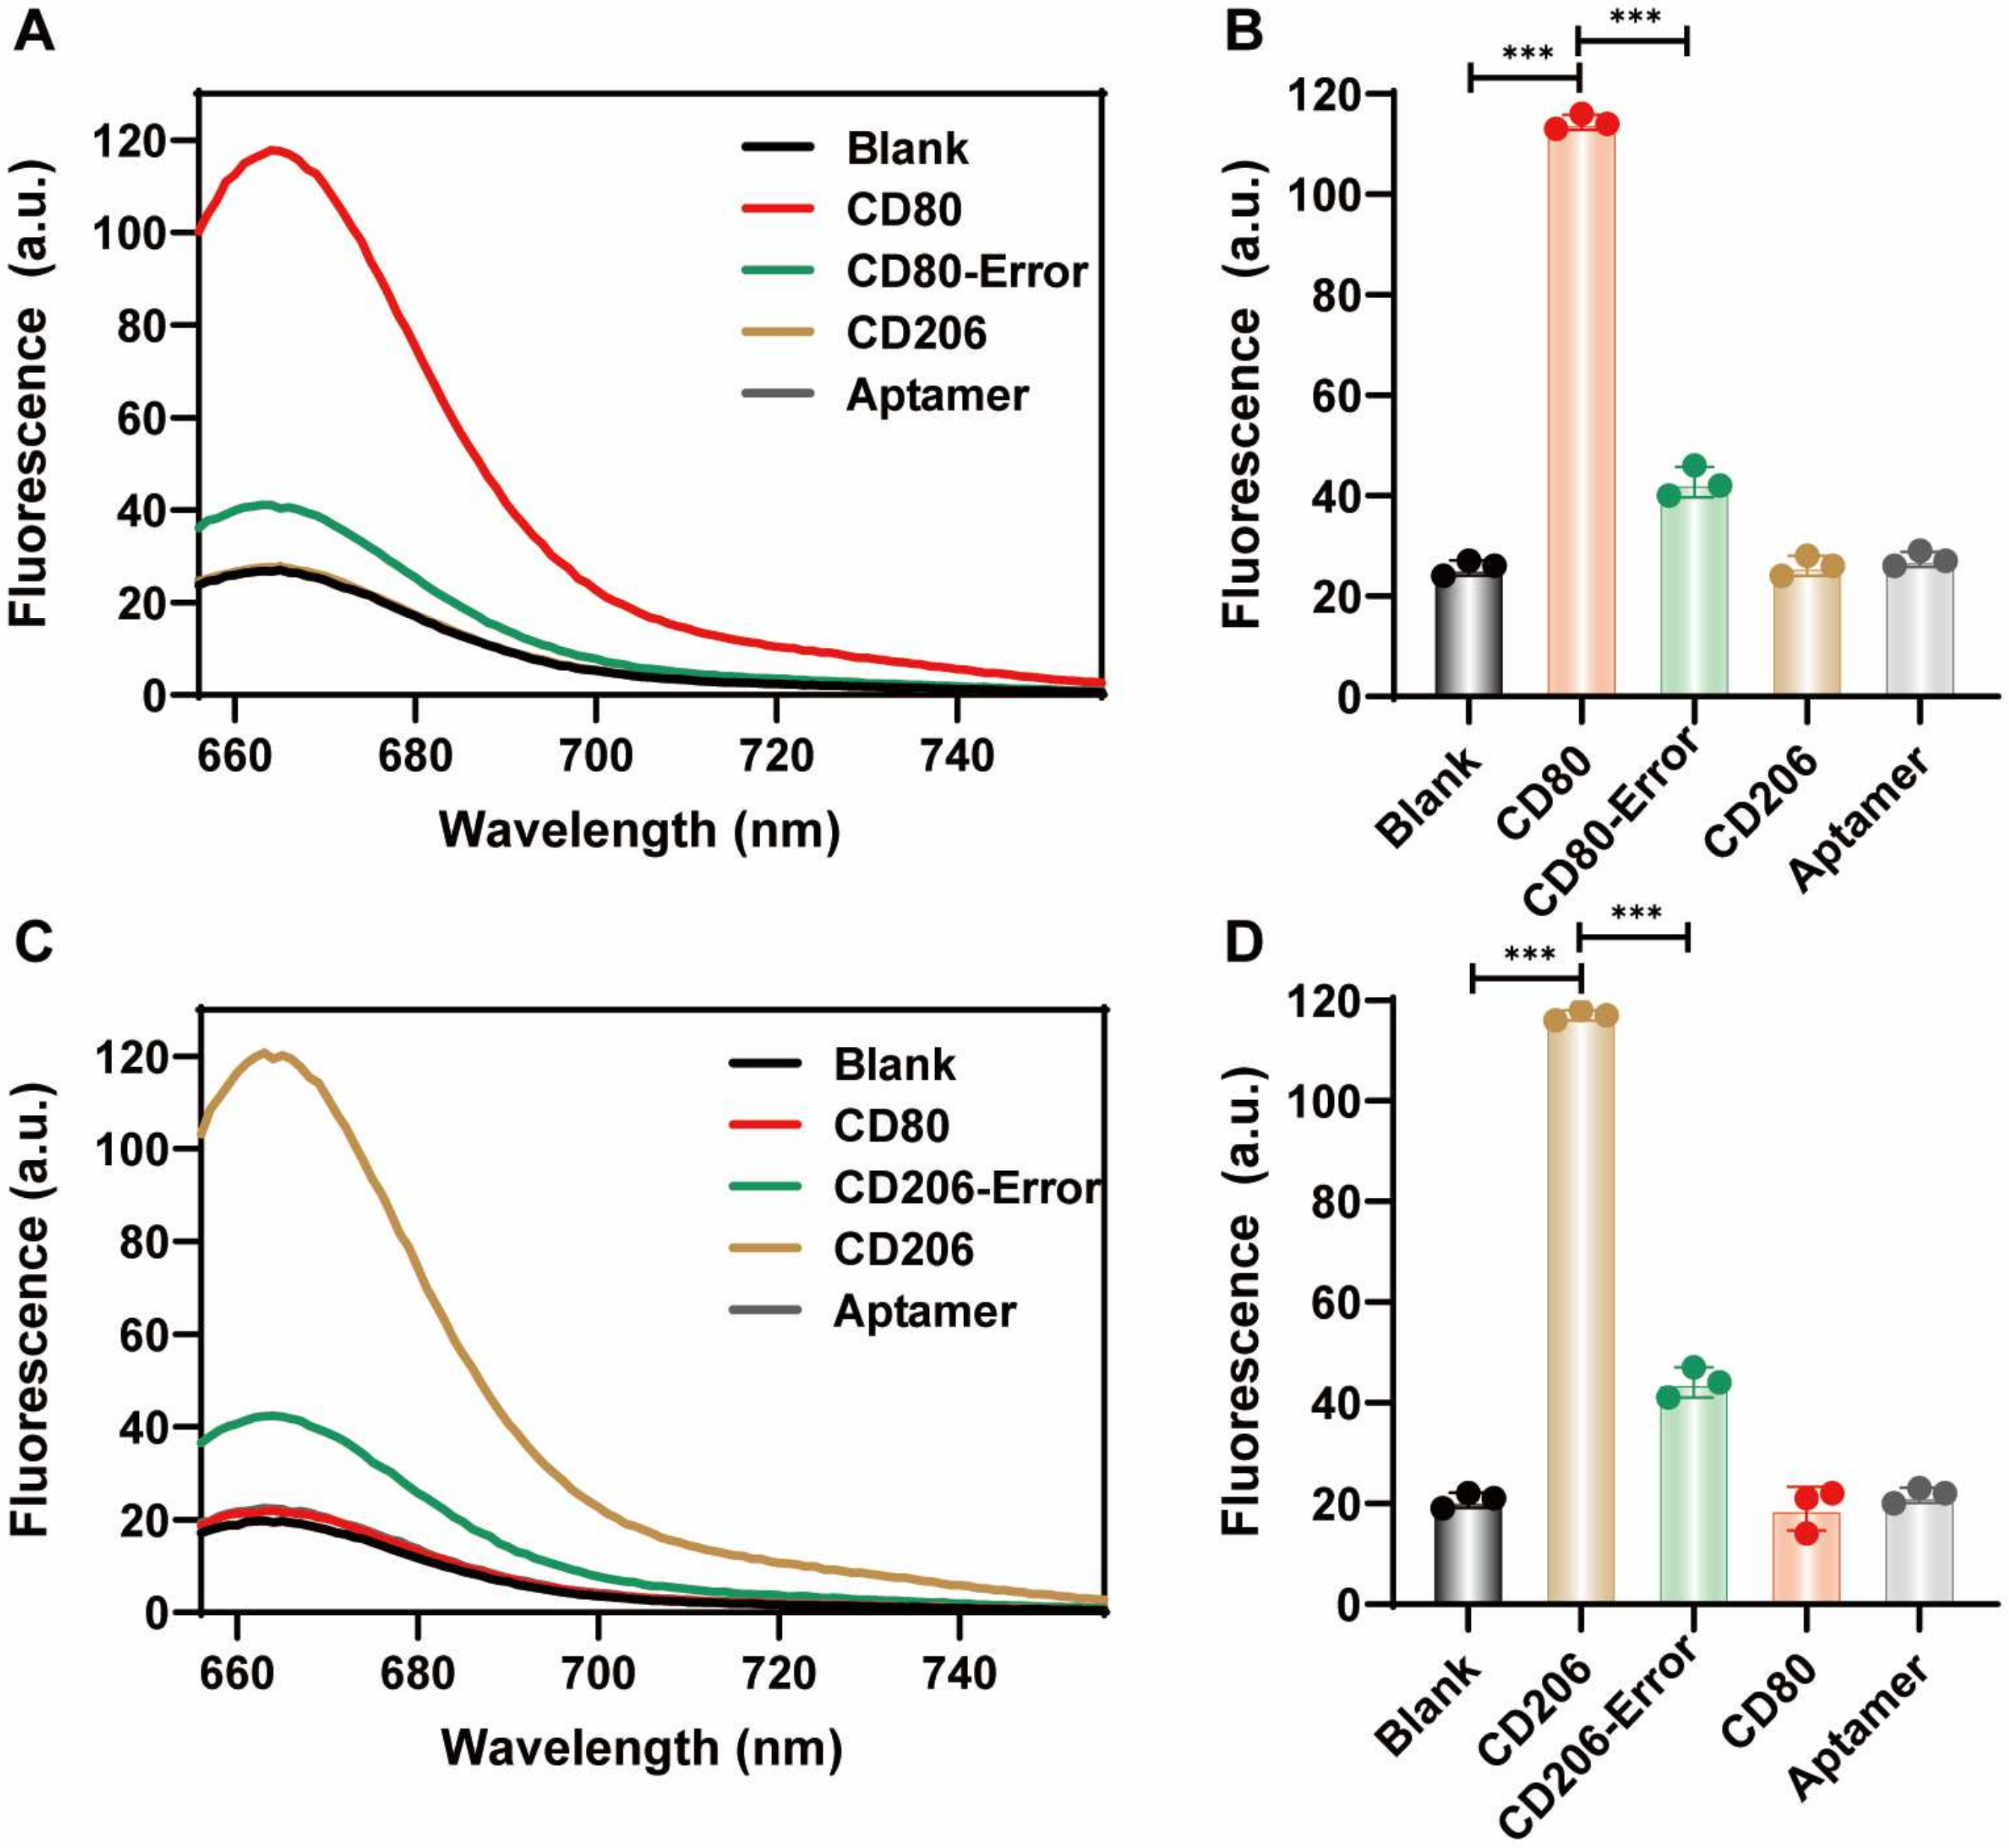
Figure 7.
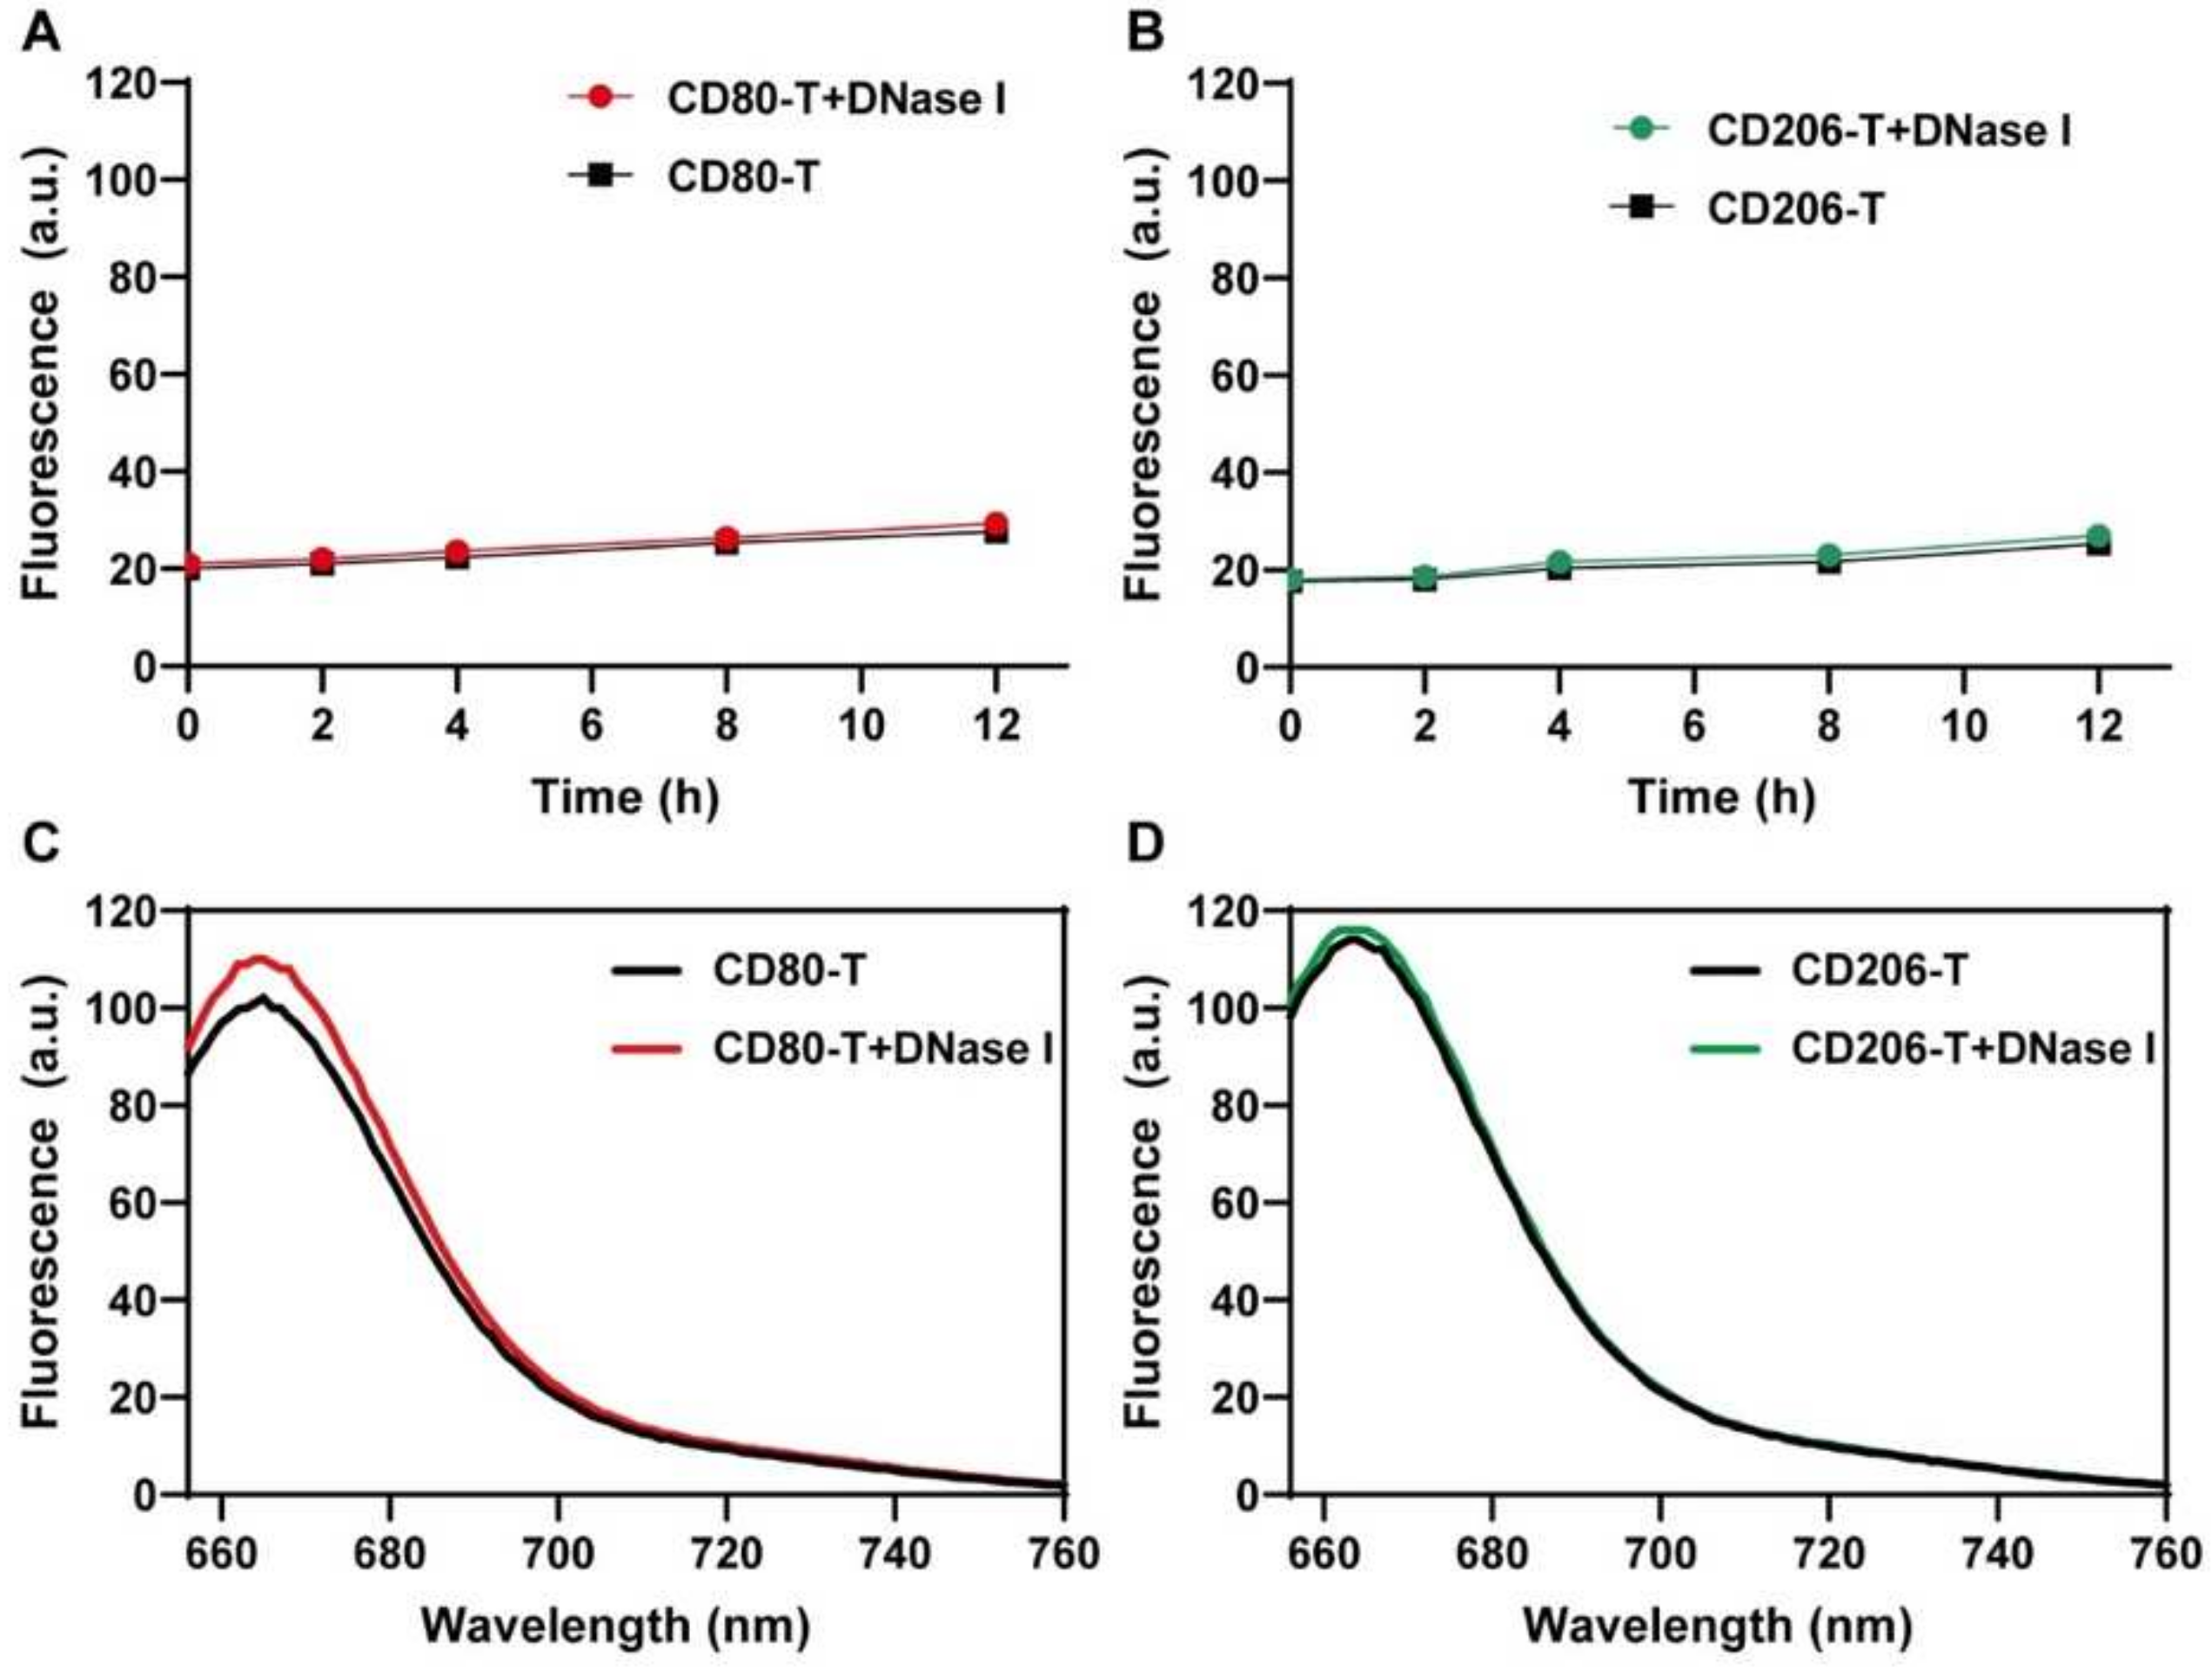
Nuclease stability of Cy5 fluorescent nanoprobes. (A,B) Background fluorescence signal change curves of M1-CD80 or M2-CD206 nanoprobes with and without DNase I enzyme over 0–12 h. (C,D) Fluorescence response of M1-CD80 or M2-CD206 nanoprobes with and without DNase I enzyme for target sequences at 200 nM concentration.
Cytotoxicity of Cy5-labeled nanoprobes. (A,B) Cellular activity of equal volumes of PBS, naked AuNPs at final concentrations of 1 or 5 nM, and M1-CD80 or M2-CD206 nanoprobes at final concentrations of 1 or 5 nM after co-incubation for 12, 24, and 48 h with mouse RAW264.7 macrophages.
Figure 8.
Cytotoxicity of Cy5-labeled nanoprobes. (A,B) Cellular activity of equal volumes of PBS, naked AuNPs at final concentrations of 1 or 5 nM, and M1-CD80 or M2-CD206 nanoprobes at final concentrations of 1 or 5 nM after co-incubation for 12, 24, and 48 h with mouse RAW264.7 macrophages.
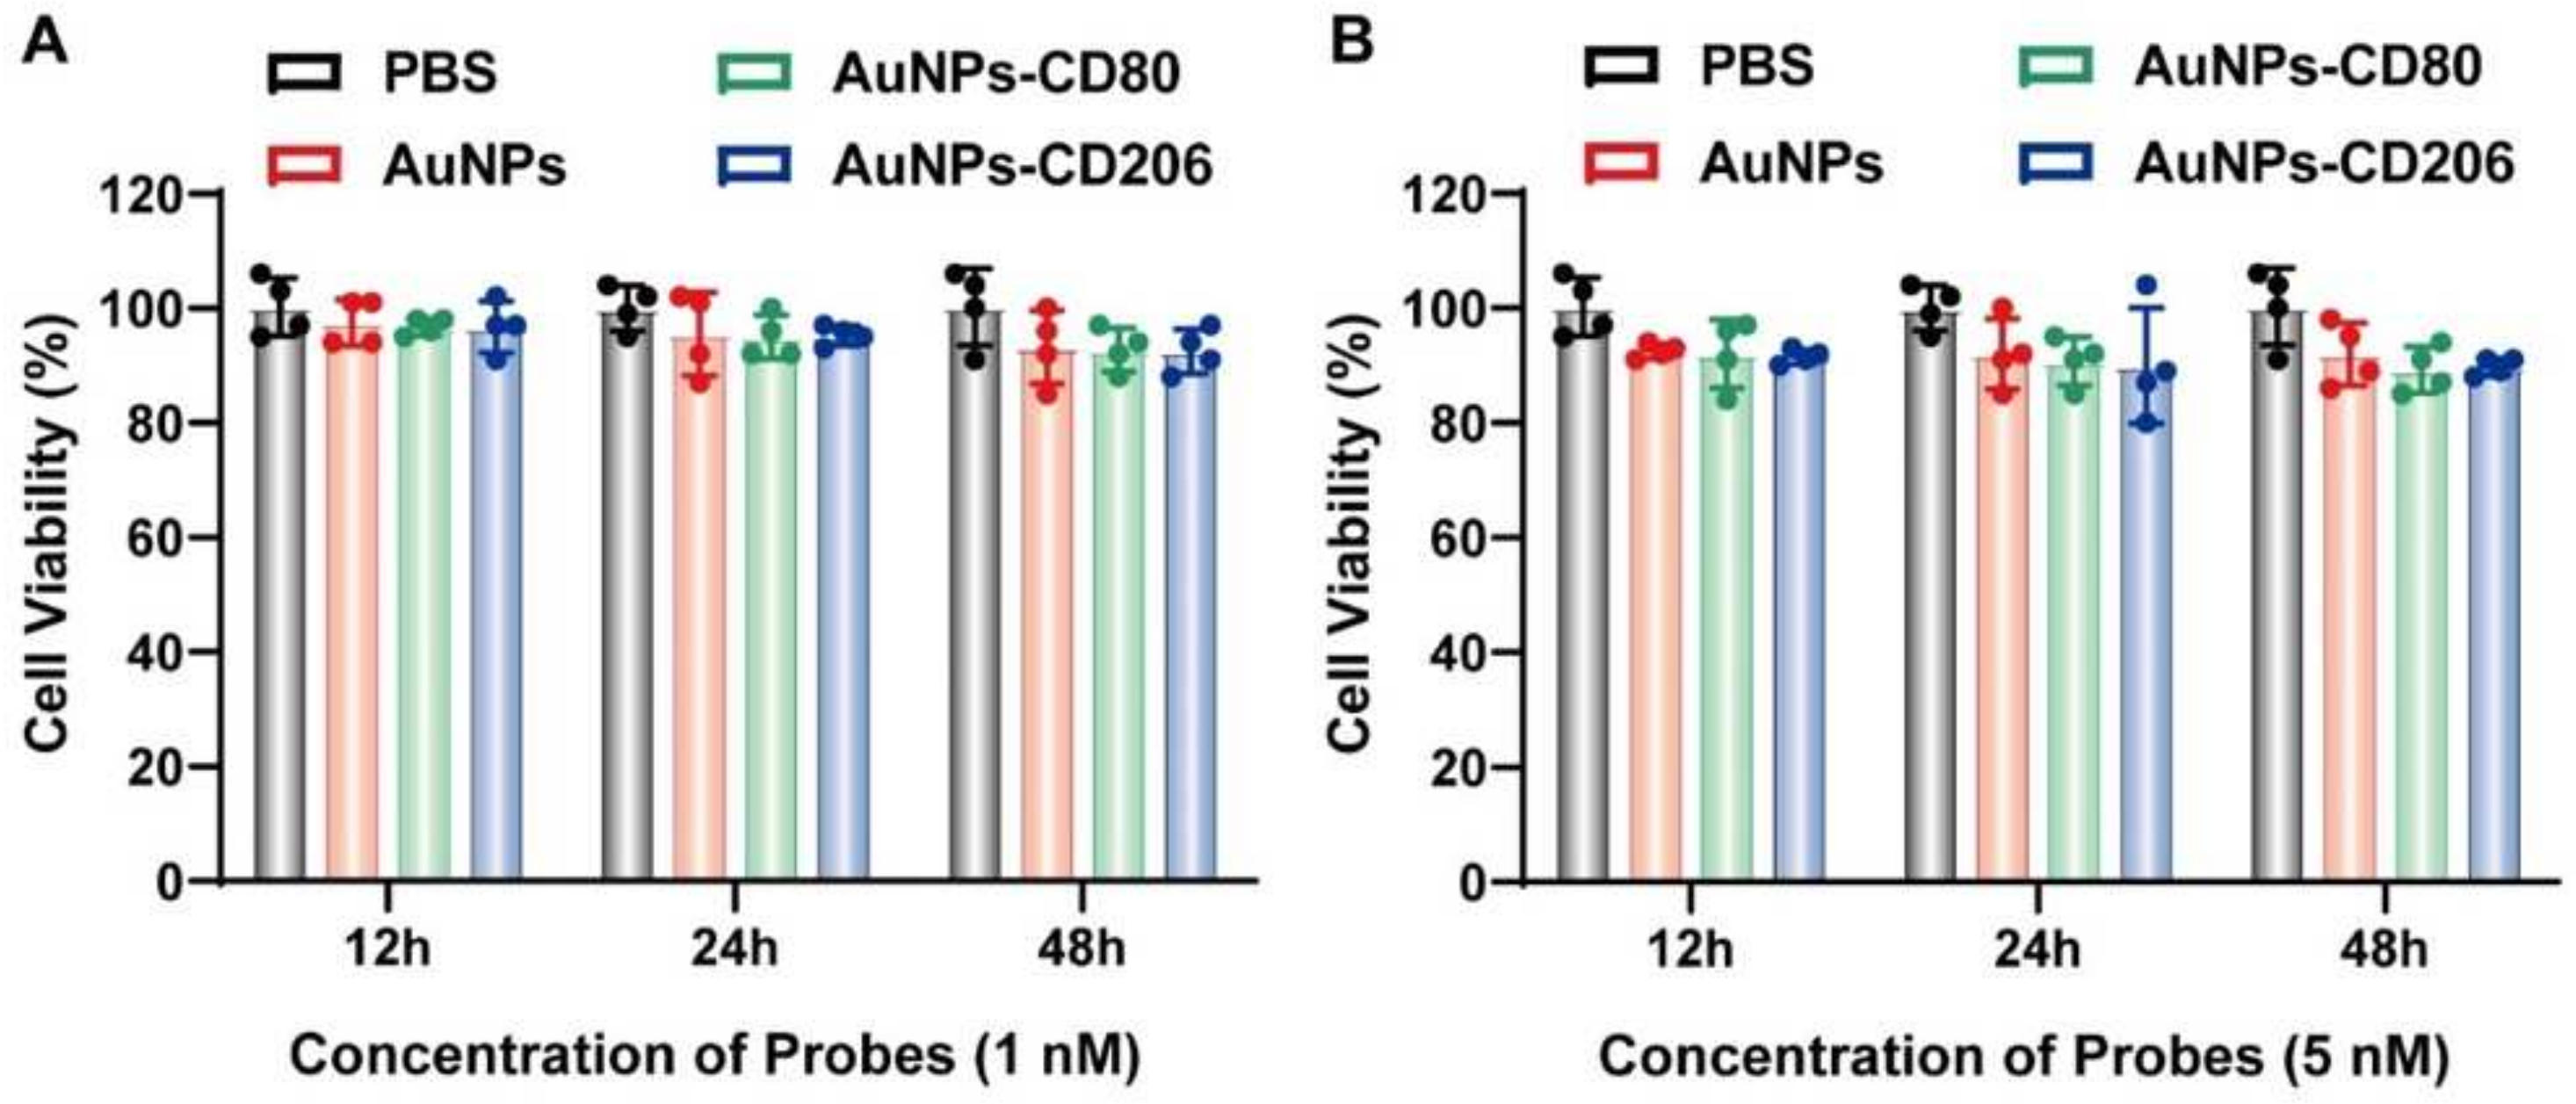
Figure 9.
(A) Fluorescence images of M0 and M1 RAW264.7 treated with Cy5-labeled fluorescent probes. Scale bar: 10 μm. (B) Intracellular fluorescence signals from M0 and M1 RAW264.7 with Cy5-labeled fluorescent mRNA probes. Data are expressed as the mean ± SEM (n = 3) (*** p < 0.001).
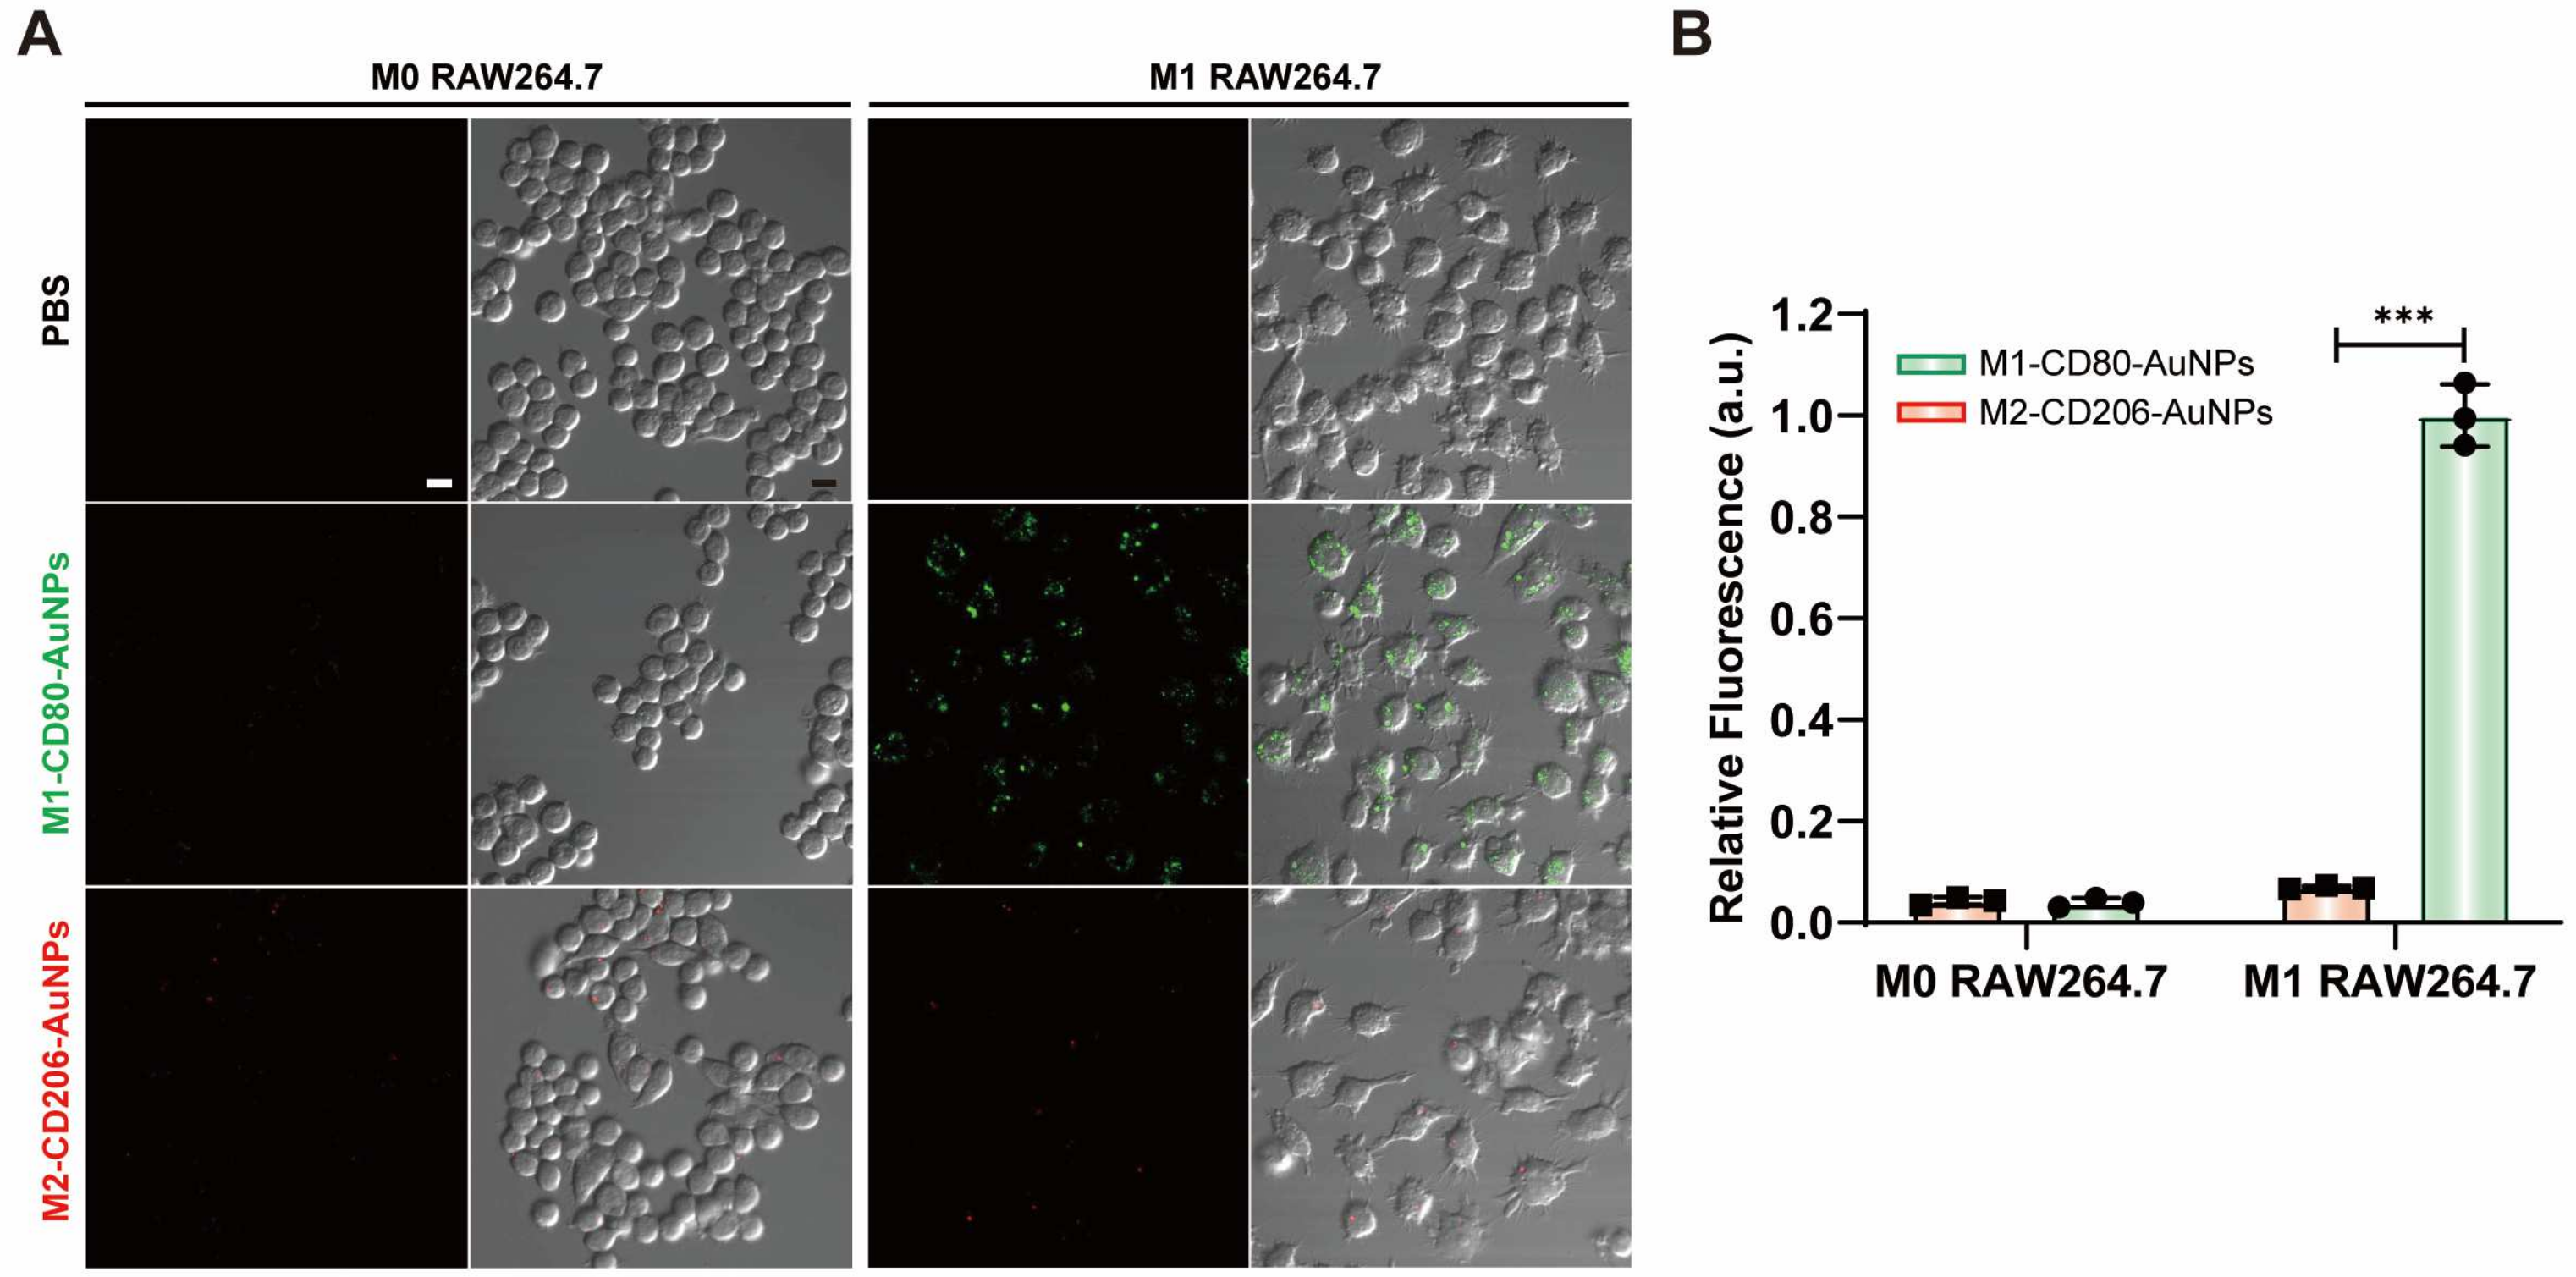
Figure 10.
(A) Fluorescence images of M0 and M2 RAW264.7 treated with Cy5-labeled fluorescent probes. Scale bar: 10 μm. (B) Intracellular fluorescence signals from M0 and M2 RAW264.7 with Cy5-labeled fluorescent mRNA probes. Data are expressed as the mean ± SEM (n = 3) (*** p < 0.001).
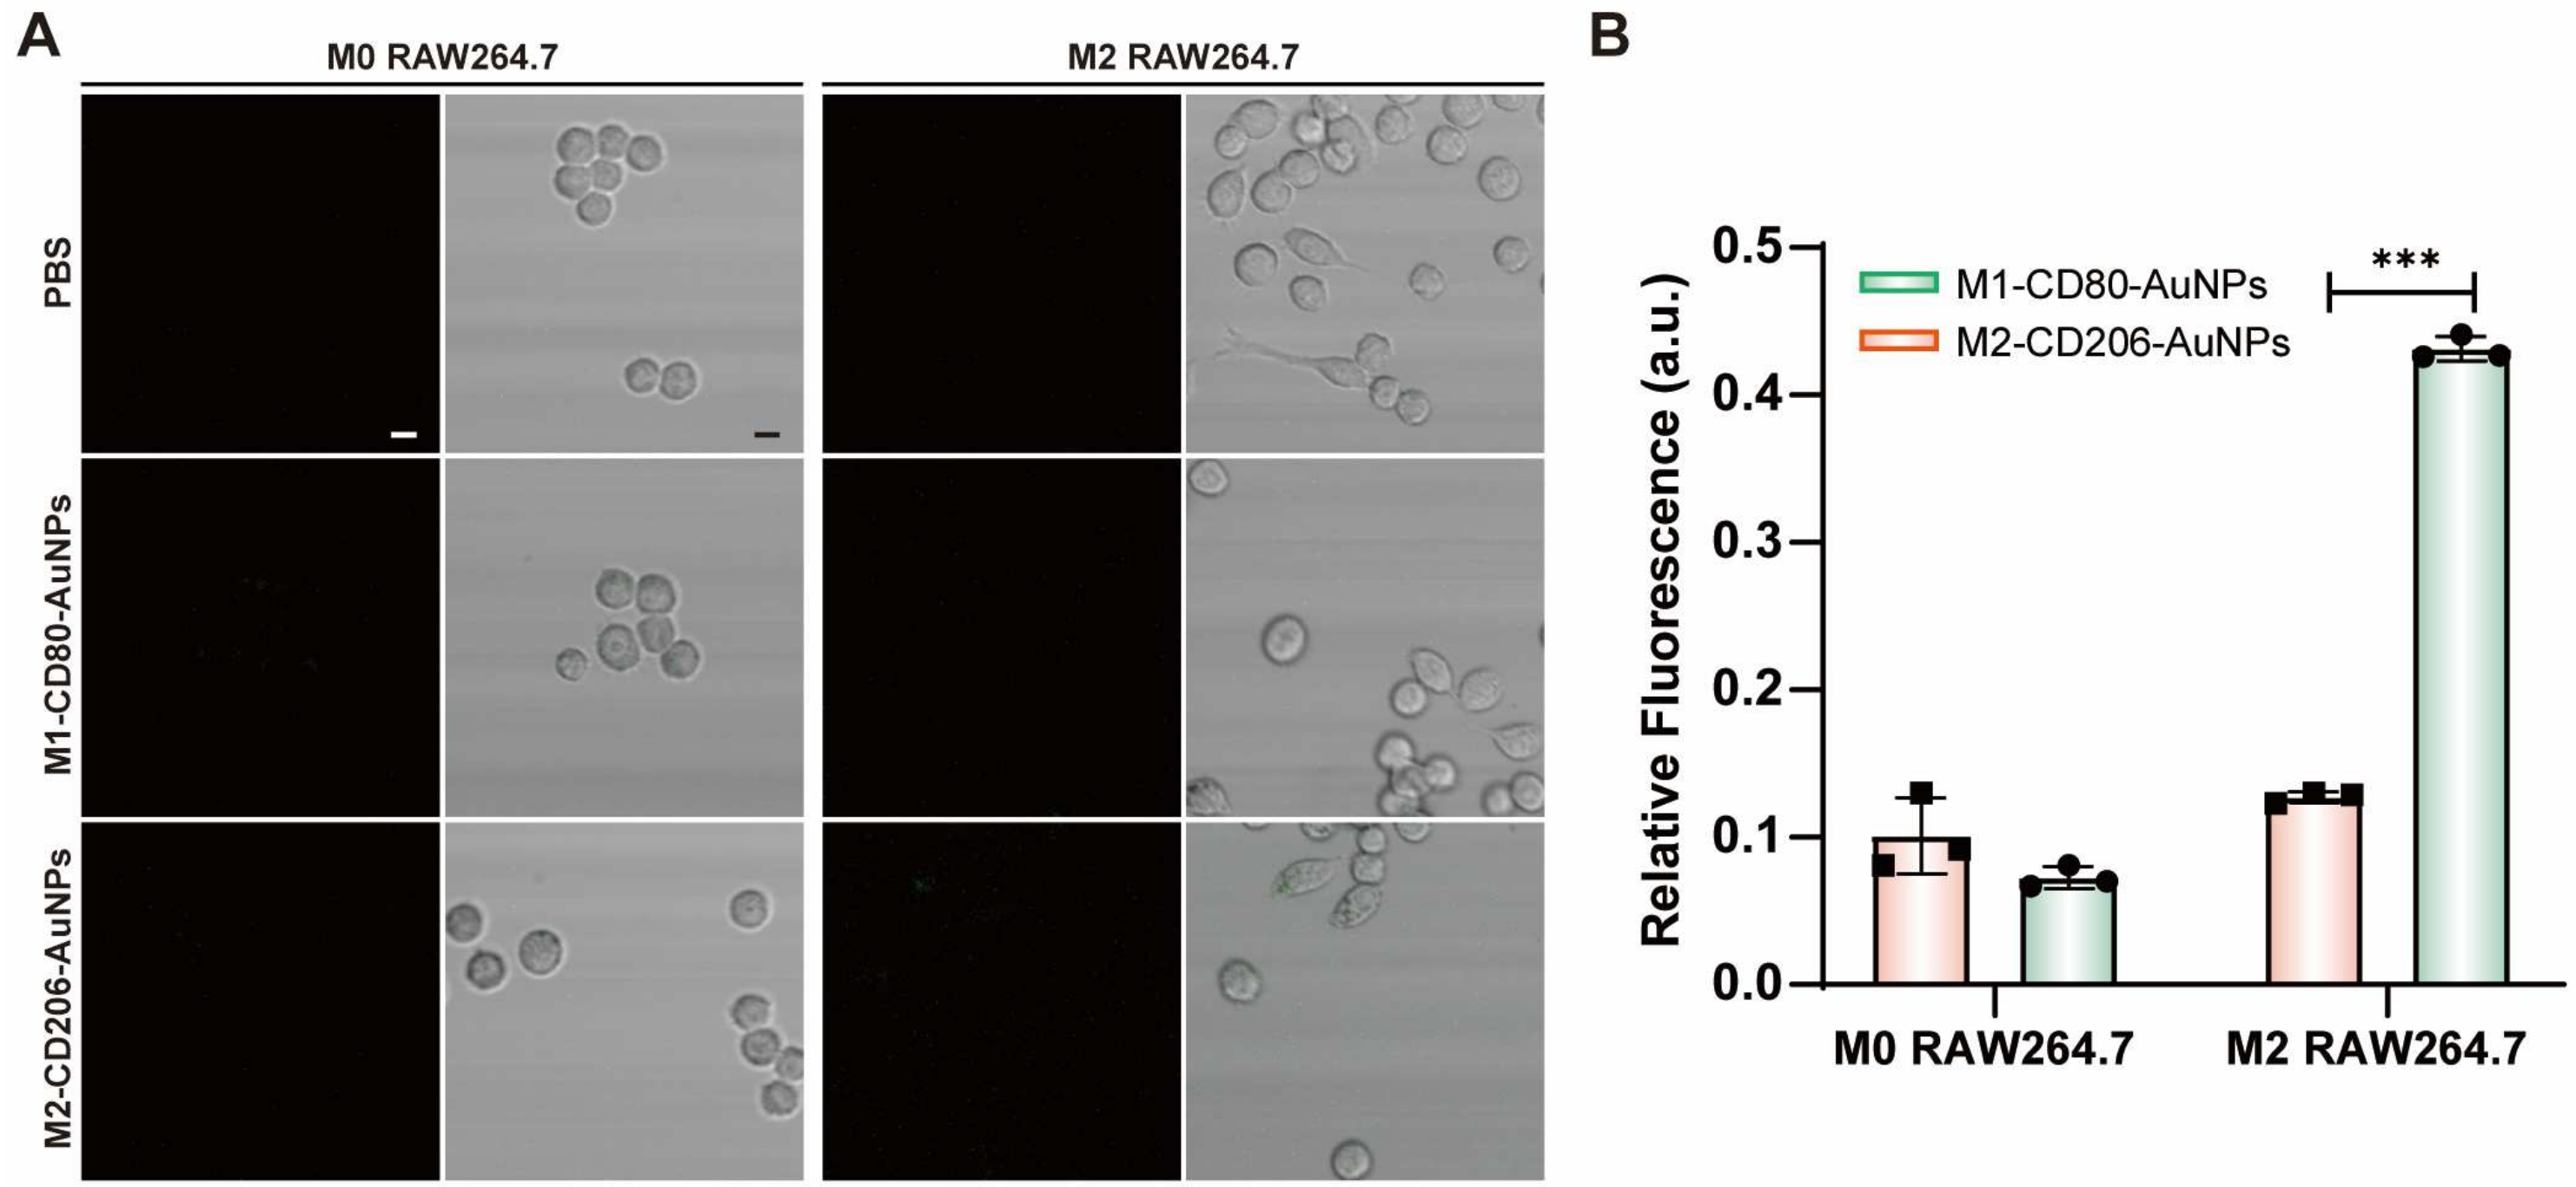
Figure 11.
(A) Fluorescence images of different phenotypes of macrophages induced by THP-1 treated with Cy5-labeled fluorescent probes. Scale bar: 10 μm. (B) Intracellular fluorescence signals from different phenotypes of macrophages induced by THP-1 with Cy5-labeled fluorescent mRNA probes. Data are expressed as the mean ± SEM (n = 3) (*** p < 0.001).

Table 1.
Sequence information for oligonucleotides used in this study.
| Name | Sequence |
|---|---|
| M1-CD80-A20 | TAGCCCTGGCTGTCCTGGAATTTT TAAAAAAAAAAAAAAAAAAAA |
| M1-CD80-Flare | Cy5-TTCCAGGACAGCCAGGGCTATACAA |
| M1-CD80-T | TTGTATAGCCCTGGCTGTCCTGGAA |
| M1-CD80-T-Eror | TTGTATAGCCCTAGCTGTCCTGGAA |
| M2-CD206-A20 | ATTTTGGCTTTTCAACACCCTTTT TAAAAAAAAAAAAAAAAAAAA |
| M2-CD206-Flare | Cy5-GGGTGTTGAAAAGCCAAAATAGTCT |
| M2-CD206-T | AGACTATTTTGGCTTTTCAACACCC |
| M2-CD206-T-Eror | AGACTATTTTGGATTTTCAACACCC |
| Aptamer | CACCCCACCTCGCTCCCGTGACACTAATGCTA |
Source link
Miaomiao Xu www.mdpi.com

