3.2. Carbonate Anion
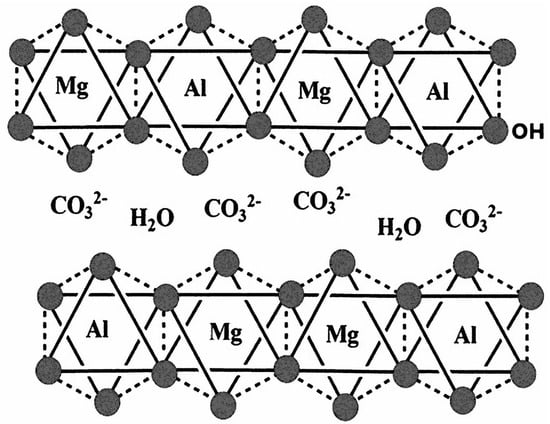
The most often studied interlayer anionic group in LDH, due to its strong affinity to the hydroxide layers, is CO32−. Going from the free anion in solution, changes can be anticipated when the CO32− is present in the interlayer space of LDH due to interactions with interlayer H2O and/or OH groups at the interlayer surfaces of the LDH layers.
The C 1s high-resolution spectrum of the carbonate anion shows a peak at a BE value of 288.6 eV (
Figure 4 left). This peak is due to the interlayer anion. The other peaks are due to surface-adsorbed organic matter, the so-called “rubbish” carbon. The corresponding O 1 peak was found at 530.5 eV (
Figure 4 right), and the ratio of O/C is about 3.10, close to the expected ratio of 3 for CO
32−. The BE value is slightly lower compared to pure carbonate minerals such as magnesite, which has a C 1s at 290.0 eV, dolomite at 289.8 eV, and calcite at 289.5 eV [
45]. This shift in BE is probably associated with interactions with the interlayer water molecules and the restrictions imposed by the LDH layers.
In earlier work, Kloprogge, Wharton, Hickley and Frost [
19] have shown by infrared and Raman spectroscopy that there is an interaction with interlayer water as shown by a water-carbonate bridging mode around 3000–3100 cm
−1. Rey et al. [
48] observed that heating Mg/Al-LDH to 100 °C resulted in the disappearance of this water-carbonate bridging mode together with the water OH-bending mode around 1616 cm
−1 due to dehydration. Relative to free CO
32− a shift toward lower wavenumbers was detected. Based on X-ray diffraction, ionic size, and charge density, it has been generally accepted that the CO
32− anion is present within the interlayer space with its C
3 axis perpendicular to the interlayer surfaces of the LDH hydroxide layers [
49]. Due to these restrictions in the interlayer space, the symmetry of the carbonate anion decreased from
D3h to
C2s, causing the activation of the IR inactive ν
1 mode around 1050–1060 cm
−1. In addition, the ν
3 showed a splitting of 30–60 cm
−1. Though IR and Raman clearly show that there are interactions between the interlayer anion and the LDH layers as well as water and that the movement of the interlayer anion is restricted, XPS shows that the binding energy of the C 1s is less than for a pure carbonate mineral indicative that the carbonate anion still has some degree of freedom inside the interlayer space.
3.3. Phosphate Anion
The interlayer phosphate anion is characterized by the P 2p3/1 peak with a BE of 133.0 eV. The corresponding P 2p1/2 is found at a BE value of 132.1 eV (
Figure 5 left). The synthesis of the phosphate-containing LDH was performed at three different pH values (9.3, 11.9 and 12.5). No difference in the BE values was observed, but a significantly higher amount of phosphate was present in the interlayer space of the LDH in the lowest pH sample. The BE value is similar to some common phosphate minerals, such as monazite, autunite, vivianite and apatite, which have P 2p3/2 Be values around 133.2 to 134 eV [
50]. On the other hand, the BE of H
3PO
4 is slightly higher than observed here at 135.2 eV. The same is true for NaH
2PO
4 with a BE of 134.0 to 134.2 eV [
51]. Wang, Cai, Han, Fang, Chen and Tan [
22] reported that the P 2p was approximately 134 eV for LDH containing hexametaphosphate. At the same time, they observed a shift in the Mg 2p and Al 2p towards higher BE. They ascribed this shift in BE to the fact that the Mg
2+/Al
3+ in the LDH hydroxide layers can extract electron density from the negatively charged oxygen atoms in hexametaphosphate [
52]. Gupta, Saifuddin, Kim and Kim [
52] found a BE shift in the Zn 2p of 0.04 eV, which is considered to be within the experimental error of XPS, while the Fe 2p showed a larger shift in BE of about 0.2 eV. In this study, no shift was observed for the Mg 2p, and there was a minor shift toward a higher BE value of 0.1 eV for the Al 2p.
The O 1s is characterized by three peaks associated with the layer hydroxyl groups at 530.9 eV, interlayer water at 532.4 eV and the interlayer PO
42− at 531.6 eV (
Figure 5 right). Again, the BE value for the oxygen in the phosphate anion is comparable to that found for various phosphate minerals, e.g., monazite (531.2 eV), vivianite (531.2 eV), amblygonite (531.6 eV) and apatite (531.0 eV) [
50]. Similar BE values are also listed in the NIST database, with, e.g., AlPO
4 at 532.8 eV [
51]. Wang, Cai, Han, Fang, Chen and Tan [
22] only reported a general position for the O 1s at about 532 eV but did not attempt to provide details fitting the different oxygen species present. Gupta, Saifuddin, Kim and Kim [
52] fitted the O 1s with three bands with the O 1s OH at 530.1 eV, slightly lower than observed here. In contrast, though, the other two peaks are at very different BE values, with an extremely broad peak at 530.9 eV assigned to H
2O, -O-Nand O-C, while a third peak at very low BE of 528.4 eV assigned to M-O. No explanation is given for what M is, but presumably, this is the P-O in the phosphate, as there are no M-O modes in the LDH hydroxide layer. These assignments do not seem to be correct as, generally, O 1s for PO
4 are always found at much higher BE.
LDHs intercalated with PO
43− have been shown to form different phases with very different basal spacings: 0.84 nm [
20], 0.78 nm, 0.80 nm, 1.19 nm [
17] and 1.11 nm [
53], depending on the synthesis conditions such as Mg/Al ratio, pH, etc. This spread in basal spacings can be explained by different positions adopted by the PO
43− between the LDH hydroxide layers (perpendicular, inclined and planar). Wang, Cai, Han, Fang, Chen and Tan [
22] even indicate that the hexametaphosphate complex stays intact within the interlayer space of the LDH after exchange. Mid-infrared and Raman spectra have been reported in a limited number of papers. Benício et al. [
54] reported the IR-active bands in the 1050 cm
−1, 870 cm
−1 and 550 cm
−1 regions, which correspond to ν
3, ν
1, and ν
4 vibrations [
55,
56]. The PO
43− anion is tetrahedral with
Td symmetry; thus, there are four normal modes of vibration, all of which are Raman active. However, only the triply degenerate ν
3 (
F2) and ν
4 (
F2) modes are infrared active. The observation of the ν
1 mode must be due to either the presence of some nitrate or carbonate instead [
19]. In contrast, Benício, Constantino, Pinto, Vergütz, Tronto and Da Costa [
53], in a paper a year earlier, claimed the presence of not only PO
43− in the interlayer space but also HPO
42−. Though the spectrum provided is of rather low quality and they do not show the band fit, they claim that the broadband in the 1020 cm
−1 region consists of the ν
3 vibrational mode of PO
43− anion and two additional bands assigned to the ν
3 and ν
2 modes of HPO
42− anion [
57]. In contrast, Gupta, Saifuddin, Kim and Kim [
52] assigned the bands at 1045 cm
−1 and 565 cm
−1 corresponding to the v
3 and v
4 band vibrations of HPO
42− or H
2PO
4− without further explanation. Wang, Cai, Han, Fang, Chen and Tan [
22] reported only a single band at 1088 cm
−1 attributed to the vibration of P-O. Shabanian et al. [
58] reported that three bands attributed to HPO
42− coalesce into a single broad band around 1056 cm
−1. In addition, a shoulder band was detected at 870 cm
−1 near the theoretical antisymmetric stretching mode of P–OH. Others also described the characteristic band related to phosphate in the interlayer of Zn/Al LDH at 1040 cm
−1 [
59] and 1048 cm
−1 [
60].
In earlier work, we reported on the Raman spectra of phosphate-LDH and addressed the possibility of determining the presence of H
2PO
4− and HPO
42− in addition to PO
43− [
17]. The Raman spectra will change if hydrogen is linked to the phosphate unit as the symmetry will change from
Td to
C3v to
C2v. This will cause a loss of degeneracy, and other bands may become visible. The sample synthesized at pH 12.5 exhibited a strong, sharp band at 960 cm
−1 with a broader band at 1026 cm
−1 assigned to the PO
43− symmetric and antisymmetric stretching vibrational modes identical to that of the PO
43− ion. Similar bands were observed for the pH 11.9 sample at 957 cm
−1 and 1032 cm
−1. Benício, Eulálio, Guimarães, Pinto, Costa and Tronto [
54] reported the formation of bands in the region between 940 cm
−1 and 960 cm
−1 after exchange with phosphate. Slight changes were also detected in the band positions in the 1050 cm
−1 region. A different Raman spectrum was obtained for the pH 9.3 sample with four bands at 964, 989, 1033 and 1138 cm
−1. In aqueous systems, the PO
43− ion has a strong band at 936 cm
−1, while HPO
42− anion exhibits a strong band at 990 cm
−1. Therefore, the spectrum can be interpreted as a combination of the PO
43− anion (964 and 1033 cm
−1) and the HPO
42− ion (989 and 1138 cm
−1). However, it is questionable whether these are actually present in the interlayer space of LDH, as XRD showed the material mainly as amorphous. For the oxyanion PO
43− the symmetric bending mode (ν
2) and the ν
4 mode are observed at 420 cm
−1 and 567 cm
−1, respectively. For the phosphate LDH at pH 12.5, a band of 474 cm
−1 was observed. A similar band was found at 472 cm
−1 for the pH 11.9 sample, while a broad band around 441 cm
−1 was present in the Raman spectrum of the pH 9.3 sample.
Infrared and Raman spectroscopy of phosphate-LDH has shown that the nature of the anion present in the interlayer space is affected by the synthesis conditions. In this study, three different pH values were studied despite the fact that in the literature, the presence of H
2PO
4− and HPO
42− have been claimed [
52,
53]. For the two samples synthesized at pH 12.5 and 11.9, Raman spectroscopy showed that this was not the case [
17]. This is further confirmed by the XPS results that show only a single P 2p 3/2 peak, as well as by the O/P ratio, which in both cases is close to 4. XPS did not allow us to distinguish between PO
43− and HPO
42− in the three samples studied.
3.4. Sulphate Anion
In naturally occurring LDH, other than the commonly present CO
32− anion, SO
42− forms an additional important interlayer anion found in minerals such as honessite (Ni
6Fe
2SO
4(OH)
16·4H
2O), hydrohonessite (Ni
6Fe
2SO
4(OH)
16·7H
2O), and carrboydite ((Ni,Cu)
14Al
9(SO
4,CO
3)
6(OH)
43·7H
2O) [
61,
62,
63].
Figure 6 shows the S 2p and O 1s of sulphate-LDH. The S 2p is characterized by a single S 2p3/1 peak with a BE of 168.3 eV. This BE is slightly lower than observed for common sulfate minerals such as baryte (169.2 eV), anhydrite (168.9 eV), or gypsum (169.2 eV) [
45], indicating that the sulfate in the LDH interlayer space is less strongly interacting with the LDH hydroxide layers compared to a sulfate group in a rigid crystal structure. In the O 1s, a single peak at 532.4 eV is associated not only with the oxygen in the sulfate group but also with oxygen in interlayer water that has a similar BE. This value is comparable with H
2SO
4, which has an O 1s BE of 532.5 eV and Al
2(SO
4)
3 of 532.4 eV [
51]. Similar results were also reported for group 1A sulfates by Wahlqvist and Shchukarev [
64].
Bish and Livingstone [
61] described for honessite the SO
42− ν
1, ν
2, ν
3, and ν
4 infrared active modes at 980, 500, 1140, and 650 cm
−1, respectively. The ν
3 mode is obviously split, though no separate band positions were provided. Since all four modes are infrared active, the symmetry of the SO
42− anion was lowered from
Td (free anion) to either
C3 or
C3v, causing the activation of the two infrared inactive modes together with the splitting of the ν
3 mode ([
65], p. 140). Earlier work in our group has shown that the infrared spectrum of Mg/Al-LDH containing SO
42− in the interlayer space exhibits a strong but broad ν
3 mode at 1126 cm
−1, a ν
4 mode at 614 cm
−1, and a very weak ν
1 mode at 981 cm
−1 [
19]. The ν
2 mode was not observed as a distinct band, in contrast to honessite and hydrohonnesite, due to its overlap with the O-M-O bending vibration of the LDH hydroxide layer around 450 cm
−1 [
66]. Fahami and Beall [
67] reported only a band at a significantly lower wavenumber position around 1066 cm
−1, which was attributed to the bending mode of interlayer sulfate ions. Liu and Yang [
68] described a single band for Zn/Al-LDH at 1113 cm
−1, which is much closer to the value observed by Kloprogge, Wharton, Hickley and Frost [
19]. Frost et al. [
69] described for glaucocerinite (Zn,Cu)
10Al
6(SO
4)
3(OH)
32∙18H
2O, a naturally occurring LDH mineral, three strong bands at 1053, 1078 and 1109 cm
−1, which was attributed to the SO
42− ν
3 antisymmetric stretching mode. A weak band at 986 cm
−1 was assigned to the corresponding ν
1 symmetric stretching mode. They also reported that carrboydite exhibited three similar bands at 1088, 1021 and 978 cm
−1, with the first two bands due to ν
3 antisymmetric stretching modes and the last band to the ν
1 symmetric stretching mode.
Kloprogge, Wharton, Hickley and Frost [
19] showed that the Raman spectrum of sulphate-LDH consisted of a very intense ν
1 mode at 982 cm
−1 together with medium intensity ν
2 and ν
4 modes around 453 and 611 cm
−1, respectively. The ν
3 mode was not observed as a separate band, even though broadband is visible around 1134 cm
−1. They indicated that when SO
42− is located in the interlayer space of LDH, the infrared ν
2 mode may become inactive, while at the same time, the ν
1 mode becomes active. In contrast to the other modes, the ν
3 is considerably broader, indicating the possible existence of two overlapping bands due to splitting. Dutta and Puri [
70] proposed a
D2 site symmetry for the sulfate anion. This is not compatible with the infrared spectrum, where all four modes are present. For analogous reasons, the
C3 site symmetry, as proposed by Bish [
71], is not compatible with the Raman spectrum. Hence, using the combined observations in both the infrared and Raman spectra Kloprogge, Wharton, Hickley and Frost [
19] concluded that the site symmetry is most probably
C2v with ν
1 infrared and Raman active, ν
2 infrared and Raman active, and ν
3 and ν
4 infrared and Raman active. A similar conclusion was reached by Lin et al. [
72] for Ni
xZn
6−xAl
2(OH)
16(SO
4)·4H
2O, while Frost, Theiss, López and Scholz [
69] concluded for glaucocerinite, a reduction in symmetry of the sulfate anion from
Td to
C2v or even lower symmetry.
It is clear from the infrared and Raman data that the sulfate anion, when present in the interlayer space, is restricted in its movement and has a lower site symmetry due to the interactions with the LDH hydroxide layers. This is also reflected in the XPS data, where the S 2p clearly shows a slightly lower BE compared to structural sulfate in mineral structures. This confirms that the sulfate anion is no longer a completely free anion, but it is, to a certain extent, interacting with the hydroxide layers.
3.5. Molybdate Anion
The MoO
4-LDH is characterized by a single peak for the Mo 3d5/2 at a BE of 229.6 eV (
Figure 7 left). This BE value is lower than, e.g., molybdenite, MoS
2, with a BE of 230.1 eV or wulfenite, PbMoO
4, with a BE of 231.9 eV [
3]. Several molybdates, such as Al
2(MoO
4)
3 (232.5 eV), CaMoO
4 (232.8 eV), NiMoO
4 (233.0), etc. all have higher BE than observed for intercalated molybdate ions in LDH. This is similar to what has been observed before, an indication that the interactions between the molybdate anion and the LDH hydroxide layers are not as strong as when the molybdate is part of a rigid crystal structure. The corresponding O 1s peak is observed at 530.3 eV (
Figure 7 right), which compares well with the value observed for wulfenite at 530.0 eV. The NIST database reports for H
2MoO
4 a BE of 530.7 eV, CaMoO
4 at 530,6 eV, and NiMoO
4 at 530.9 eV, while for Al
2(MoO
4), the BE ranges from 530.7 to 531.0 eV [
51]. Thao et al. [
73] assigned the Mo 3d5/2 peak at 232.6 eV to Mo(VI) in MoO
42−. The hardly visible shoulder at 231.7 eV was attributed to Mo(V) species, possibly caused by a charge transfer between (Mo
6+ + O
2−) and (Mo
5+ + O
−) [
74,
75]. This shoulder was not observed in this study. Thao, Trung and Van Long [
73] also reported the BE value of O 1s at 532.4 eV for the fresh molybdate-LDH assigned to the O
2− [
35,
38,
45]. They concluded that it is probably composed of two overlapping photoelectron peaks at 532.4 and 531.5 eV. The peak at 532.4 eV was assigned to the metal hydroxides in the LDH layers, while the other peak at 531.6 eV was attributed to oxygen O
− in the oxomolybdenum. Both the Mo 3d5/2 and O 1s peaks for the MO
42− anion are at slightly higher BE values than observed in this study and in comparison with other molybdate structures such as those listed in Kloprogge and Wood [
45] and the NIST database [
51].
Previously, infrared and Raman spectroscopy on the same sample studied here have shown that molybdate anions are not polymerized in the interlayer space of the LDH because of the synthesis under alkaline conditions. The splitting of the vibrational modes of the molybdate anion in the vibrational spectra suggests a symmetry lowering due to interactions of the molybdate anion with the LDH hydroxide surfaces and interlayer water [
16]. Palmer, Soisonard and Frost [
21] reported a sharp Raman band at around 900 cm
−1, which was assigned to the MoO
42− symmetric stretching mode. A single broad IR band at approximately 830 cm
−1 was reported as characteristic of the MoO
42− anion, by Klemkaitė-Ramanauskė et al. [
76]. Mitchell and Wass [
77] confirmed the finding of Adebajo, Musumeci, Kloprogge, Frost and Martens [
16] that at pH above 7–8, the prevalent molybdate species was the MoO
42− ion characterized by an IR band at ca. 830 cm
−1, while LDH prepared at pH 4.5 and with high molybdate loadings had an IR band at ca. 920–930 cm
−1 and bands or shoulders near 890 cm
−1 suggesting the presence of polymolybdate. Nejati et al. [
78] reported a single band in the IR spectrum at 806 cm
−1 assigned to the antisymmetric stretching mode of Mo–O. Yu et al. [
79] observed a similar IR band attributed to the antisymmetric mode of Mo–O–Mo in MoO
42− at 834 cm
−1. Their Raman spectrum showed the Mo–O symmetrical stretching mode in MoO
42− at 910 cm
−1, while two bands at 320 and 220 cm
−1 were attributed to the Mo = O bending and Mo–O–Mo deformation mode, respectively. A tetrahedral ion like MoO
42− has four vibrational modes if it has full Td symmetry. These consist of ν
1 (
A1), ν
2 (
E), ν
3, and ν
4 (
F2). The
A1 symmetric stretching mode and the
E bending mode are Raman active only, while the
F2 stretching and bending modes are both IR and Raman active. For MoO
42− the fundamental modes are found at 894 cm
−1 (ν
1), 381 cm
−1 (ν
2), 833 cm
−1 (ν
3), and 318 cm
−1 (ν
4) [
80]. Based on these fundamental modes, it seems incorrect to attribute the IR bands at 823 cm
−1 and 635 cm
−1 to antisymmetric and symmetric stretching vibrations of Mo-O bonds, as suggested Colombo et al. [
81]. The most complete description has probably been provided by Thao, Trung and Van Long [
73]. In the IR spectrum, they observed a broad band at 920 cm
−1, which was attributed to the vibrations of Mo = O in polymolybdate Mo
7O
246−. A band at 670 cm
−1 with a shoulder at 856 cm
−1 was assigned to the Mo–O–Mo stretching mode of Mo O
42− in the interlayer space of LDH. It is more likely that the 670 cm
−1 band is associated with NO
3−—in the system, which is supported by the band at 1370 cm
−1. In the Raman spectra, the MoO
42− symmetric stretching modes in the LDH were observed at 908 and 892 cm
−1. They were interpreted as being associated with two different MoO
42− anionic species; the first one is hydrated, and the other one is bonded to the brucite-like hydroxide surface of the LDH within the interlayer space [
18]. A broad shoulder at 823 cm
−1 was ascribed to the MoO
42− antisymmetric stretching mode, while a band at 325 cm
−1 was attributed to the Mo-O bending mode [
79].
Infrared and Raman spectroscopy have shown that the nature of the molybdate anion can change depending on the synthesis conditions, in particular, the pH. Under alkaline conditions, the MoO
42− anion is dominant, either in a hydrated state or forming a stronger interaction with the hydroxide layer of the LDH within the interlayer space, as shown by the slight shift in band positions. Such small changes can not be observed in the XPS spectrum, which only shows that the Mo 3d5/2 peak is found at a slightly lower BE than for molybdate in a rigid crystal structure, indicating that, although there is some interaction with the LDH layer structure, the interaction is not as strong as in molybdate minerals such as wulfenite or other crystalline molybdate compounds [
45,
51]. In addition, no proof was found for the existence of charge transfer between (Mo
6+ + O
2−) and (Mo
5+ + O
−), as suggested in some papers [
74,
75].
3.6. Chromate Anion
The Cr 2p high-resolution spectrum of the chromate intercalated LDH differs from the other anionic groups shown earlier in this paper in the sense that not one but two Cr 2p3/2 peaks are present (
Figure 8 left). The first is a rather broad peak with a BE of 579.0 eV, while the second is much sharper and has a BE of 580.2 eV. The second peak is characteristic of Cr
6+ in the CrO
42− anion, while the first peak at lower BE is associated with the presence of Cr
3+, indicative of substantial reduction of the CrO
4 with time. Approximately 60% of all Cr has been reduced based on the peak surface area ratio, which is directly proportional to the amounts present. The mineral crocoite PbCr
VIO
4 showed a Cr 2p3/2 at 579.3 eV [
45], while a compound such as BaCr
VIO
4 has a BE of 579.1 eV. In contrast, Cr
III(OH)
3 has a lower BE of 577.1–577.4 eV [
51]. Alidokht et al. [
82] observed that upon adsorption of chromate using LDH, complete reduction of the Cr
VI to Cr
III took place with Cr 2p3/2 peak at a BE of 277.9 eV. A similar shift was also observed for the reduction of sodium chromate during ion etching in the XPS instrument by Treverton and Davies [
83]. The Cr
3+ is probably initially present in the form of Cr(OH)
63− but this anion shows a strong affinity for carbonate [
84], so the exchange of OH
− for CO
32− in the anion over time is well possible within the LDH interlayer space given that LDH itself also has a strong affinity for carbonate adsorption. The O 1s peak for the chromate is found around 530.2 eV, which is the same as that of crocoite, PbCrO
4 [
45], and comparable to compounds such as Na
2CrO
4 at 530.0–530.3 eV, CaCrO
4 at 529.5 eV and Li
2CrO
4 at 530.3 eV [
51]. The O 1s peak for Cr
III compounds occurs at slightly high BE and can not be distinguished from the O 1s OH peak of the LDH layer structure (
Figure 8 right). The NIST database reports BE values of 530.8 to 531.6 for Cr(OH)
3 [
51].
Vibrational spectroscopy (Raman and FTIR) results on the fresh sample showed that the initial chromate anions were not polymerized to Cr
2O
72− in the LDH interlayer space [
16]. The Raman spectrum of the chromate anion in solution reveals distinct vibrational modes: the symmetric stretching mode (ν
1) is observed at 848 cm
−1, the bending mode (ν
2) at 348 cm
−1, the asymmetric stretching mode (ν
3) at 884 cm
−1, and the out-of-plane bending mode (ν
4) at 363 cm
−1 [
80]. Frost, Musumeci, Martens, Adebajo and Bouzaid [
18] reported the Raman spectrum of the same freshly prepared sample as later used in this study for the XPS analyses. They observed a strong band at 848 cm
−1 attributed to the ν
1 symmetric stretching vibrational mode, while two bands at 884 and 928 cm
−1 were assigned to the ν
3 antisymmetric stretching vibrational mode. The band at 474 cm
−1 was assigned to the ν
4 bending mode. Finally, two bands at 363 and 237 cm
−1 were interpreted as being the ν
2 bending modes. The splitting of the ν
3 and ν
2 modes is suggestive of an initial lowering of the symmetry of the chromate anions in the LDH interlayer space prior to partial reduction. The symmetry lowering must be taken into account through the interaction of the CrO
42− anions with both interlayer water and the LDH hydroxide layer surfaces on both sides of the interlayer space. They did not give an explanation for a broad band at 821 cm
−1. Although this is lower than reported for fresh Cr(OH)
3 around 850 cm
−1 [
85], it is possible that this band is associated with the start of the reduction of the Cr
6+ to Cr
3+ and represents the Cr-OH symmetric and antisymmetric stretching mode and the shift is due to the restricted space within the LDH interlayer space. The IR interlayer CrO
42− υ
3 (Cr-O) mode was reported at 870 cm
−1 by Del Arco et al. [
86], while Prasanna and Vishnu Kamath [
87] found the same band at 866 cm
−1. After heating between 100 and 200 °C, a split of this band was observed, and two new bands appeared around 874 and 930 cm
−1, supporting a change in the anion symmetry from
Td to
C3v as a result of the interaction between the CrO
42− and the LDH hydroxide layers similar to what was observed in the Raman spectra by Frost, Musumeci, Martens, Adebajo and Bouzaid [
18]. Prasanna et al. [
88] also observed in the mid-IR spectrum of intercalated CrO
42− two bands at 866 and 917 cm
−1. The tetrahedral chromate ion is characterized by two distinct IR-active vibrational modes: the antisymmetric stretch (ν
3) and the symmetric deformation mode (ν
4). The ν
4 is expected to be observed around 330 cm
−1, i.e., outside the mid-IR range and therefore not observed. The two bands represent the triply degenerate (
F2) mode of the chromate. With
C3v symmetry, the antisymmetric stretching vibration splits into two modes (
A1 +
E) ([
65], p. 414).
The XPS Cr 2p high-resolution scan of the chromate-LDH provided evidence that upon aging, the nature of the interlayer anion changed, resulting in the reduction of Cr
6+ to Cr
3+. Since the Raman spectrum of the same sample was taken shortly after synthesis, the spectrum did not show any significant evidence of this reduction [
18]. Instead, the Raman spectrum is dominated by the CrO
42− anion with a reduced symmetry, as has also been observed in the infrared spectra of fresh chromate-LDH samples. The XPS data were obtained about 6 months after the Raman spectra, and by then, approximately 60% of the Cr
6+ was reduced to Cr
3+.
3.7. Hexacyanoferrate Anions
In earlier work by Kloprogge, Ponce and Ortillo [
50] for the hexacyanoferrate(II) anion intercalated in LDH, the N 1s peak was found at 397.1 eV for Fe(CN)
64− while for Fe(CN)
63− it was observed at 397.4 eV (
Figure 9 left). The NIST database shows that Fe(CN)
64 compounds have N 1s BE values of around 397.4 to 398.0 eV, while K
3Fe(CN)
6 had a BE of 398.1 eV [
51], indicating that there is a minor difference in BE for N 1s in these two anions.
There were significant differences in the Fe 2p3/2 high-resolution spectra, with the Fe(CN)
63− exhibiting the main peak at a BE of 707.7 eV and a second peak at a BE of 709.5 eV. In contrast, the Fe(CN)
64 spectrum exhibited only one peak at 707.8 eV (see Figure 14 in [
50]). For K
4Fe(CN)
6, the NIST database shows a BE value of 707.1 and 708. 5 eV, while for K
3Fe(CN)
6, it was reported at 709.6 eV [
51]. Holgado et al. [
89] used Fe-XANES analysis to show that partial reduction of the Fe(III) in the Fe(CN)
64 intercalated LDH had taken place. Moreover, Idemura, Suzuki and Ono [
32] showed the reduction of Fe(III) in Fe(CN)
64 complexes by Mössbauer spectroscopy. Yamashita and Hayes [
90] found that the Fe 2p3/2 for Fe(II) has a BE of about 1 eV lower than Fe(III) in their oxides. The same is true for the potassium hexacyanoferrates and in this study of intercalated LDH with hexacyanoferrates. Kloprogge, Ponce and Ortillo [
50] concluded that the Fe 2p3/2 peak at 707.7 eV is due to Fe(II) caused by partial reduction in the initial Fe(III) observed at 709.46 eV. In their study, they did not report on the C 1s results for these two samples; for the Fe(CN)
64− LDH, the C 1s of the C-N bond was observed at a BE value of 283.5 eV while for Fe(CN)
63− LDH at was observed at 283.9 eV (
Figure 9 right). These BE values, and the small difference between the two compare well with the values and differences reported for K
4Fe(CN)
6 at 283.5 eV and K
3Fe(CN)
6 at 283.9 eV [
51].
The infrared and Raman spectra of hexacyanoferrate intercalated LDH have been reported for the last 30 years. Kikkawa and Koizumi [
91] reported a band around 2000 cm
−1 was assigned to the CN stretching mode. In contrast, Idemura, Suzuki and Ono [
32] observed for the anion-exchanged LDH in an aqueous solution of K
3Fe(CN)
6 resulted in two bands at 2120 and 2040 cm
−1 in the CN stretching region, indicating that part of the cyanoferrate(III) complex was reduced to cyanoferrate(II) complex during the intercalation. They based this on the fact that pure K
3Fe(III)(CN)
6 and K
4Fe(II)(CN)
6.3H
2O produce IR active bands at 2120 and 2040 cm
−1, respectively. After the intercalation of Fe(CN)
64− in the LDH, no change in the oxidation state of Fe was detected. A band at 2040 ± 4 cm
−1 was the stretching vibration of ν(CN) of Fe(CN)
64− intercalated in LDH by Mao et al. [
92]. Amini, Rahimpour and Jouyban [
29] reported two bands at 2038 and 2113 cm
−1 for Fe(CN)
63− intercalated Ni/Al–LDH assigned to CN bound to Fe(II) and to CN bound to Fe(III), respectively. Panda et al. [
93] described an intense sharp band at 2094 cm
−1 attributed to the CN stretching mode of hexacyanoferrate(III) anions, but in addition, two weak bands were observed around 2002 and 2163 cm
−1. The band at 2002 cm
−1 was interpreted as being due to the partial reduction of Fe
3+ to Fe
2+. The weak band at 2163 cm
−1 was thought to be the result of the formation of nickel ferricyanide, in which the hexacyanoferrate(III) anion is free from the LDH layers. Likewise, Meng et al. [
94] observed a band at 2111 cm
−1 was assigned to the CN stretching mode of hexacyanoferrate(III), and a second weak band at 2034 cm
−1 was attributed to the CN stretching mode of hexacyanoferrate(II), suggesting that a small amount of Fe
3+ was reduced to Fe
2+ in the LDH interlayer space. Holgado, Rives, Sanromán and Malet [
89] described two sharp bands at 2035 ±1 cm
−1 assigned to the CN stretching mode of hexacyanoferrate(II) and at 2120–2086 cm
−1 attributed to the CN stretching mode of hexacyanoferrate(III) intercalated in LDH.
Hansen and Koch [
31] detected the CN-stretching mode of hexacyanoferrate(II) and (III) at 2036 and 2112 cm
−1, respectively. In addition, they observed a band at 2080 cm
−l, which they attributed to the presence of free cyanide anions in the interlayer space of the LDH, indicating that the hexacyanoferrate(II,III) cyanide ligands can be replaced with either water or hydroxyls. In addition, oxidation and ligand substitution of the hexacyanoferrate(II) were observed by Mössbauer spectroscopy. In contrast, Yao et al. [
95] attributed a band at 2030 cm
−1 when Fe(CN)
63− was incorporated in LDH to a CN
− group in which the bond strength of CN
− was weaker due to the interaction with the LDH hydroxide layer. The intensity of the band at 2030 cm
−1 was shown to increase upon aging. Crespo, Barriga, Rives and Ulibarri [
35] remarked that regardless of the nature of the starting hexacyanoferrate, two separate or overlapping bands were observed in all cases. Furthermore, the two bands are found closer to each other (maximum Δν = 46 cm
−1) than for the pure potassium salts (Δν = 73 cm
−1), indicating that the samples underwent redox processes resulting in a mixture of Fe
2+ and Fe
3+ species. They indicated that it is common knowledge from coordination chemistry that the exact band position of the ν(CN) stretching mode for hexacyanoferrate(II) varies with the nature of the counter-cation. In the case of intercalated LDH, hydrogen bonding between interlayer water molecules or the LDH hydroxide layer hydroxyl groups and the cyano groups may likewise have an effect on the exact band position. Fernández et al. [
96] observed the most intense band at 2118 cm
−1. In addition, a weak band was observed at 2042 cm
−1, while even weaker shoulders were detected at 2089 and 2060 cm
−1. The ν
CN band, at 2042 cm
−1, indicates a partial Fe
3+ to Fe
2+ reduction within the LDH interlayer space, similar to other studies. It is known that hexacyanoferrate anions are outer-sphere electron-transfer reductants or oxidants [
97,
98], based upon which the origin of the two weaker bands at 2089 and 2060 cm
−1 can be assigned. Based on Jones [
99] the
A1g,
Eg and
T1u ν
CN modes required by the
Oh point group for Fe(CN)
64− are found at 2094, 2062 and 2044 cm
−1 in aqueous solution. The first two modes are infrared-forbidden, but in the restricted interlayer space of the LDH, they can become partially activated due to a decrease in symmetry, resulting in the two weak bands at 2089 and 2060 cm
−1, respectively. If grafting had happened (if the calculated interlayer space height was smaller than the size of the Fe(CN)
64− anion along the
C3 axis), the decrease in symmetry would have been much more dramatic, and the infrared spectrum much more complicated. Braterman et al. [
100] and Boclair et al. [
101] studied oriented samples of hexacyanoferrate intercalated LDH and compared those to randomly oriented samples. The random-oriented intercalated LDH exhibited two overlapping bands of similar intensity, with the higher wavenumber band being the broader of the two. This higher wavenumber band at 2041 cm
−l was still visible in the oriented sample, with unaltered band shape and width, but the sharper, lower wavenumber band at 2035 cm
−1 was no longer visible. Therefore, both these intense bands were interpreted to correlate with
T1u in
Oh, and their separation is proof of a local reduction of symmetry. They attributed this effect to a change to
D3d symmetry by the ferrocyanide anion, resulting in a splitting of this mode into
Eu and
A2u components. The symmetry reduction is a result of the orientation of the ferrocyanide anions in the interlayer space of the LDH, which lies with two opposed triangular faces of the coordination octahedron parallel to the internal surfaces of the LDH hydroxide layers. Under these circumstances, the
Eu component is likely to be broader than the
A2u component. Furthermore, the
Eu component is x,y-polarized in the molecular axis system, while the
A2u component is z-polarized. This explains the detected selectivity. The molecular three-fold z-axis, the crystallographic c-axis, and the direction of light propagation are all parallel in the oriented LDH sample.
Two Raman spectroscopic studies on hexacyanoferrate intercalated LDH were published by Kloprogge et al. [
102] and Frost, Musumeci, Bouzaid, Adebajo, Martens and Theo Kloprogge [
30]. Details about the symmetry of the hexacyanoferrate anion and its reduction and oxidation behavior after intercalation in LDH can be obtained by comparing the Raman spectra with the infrared spectra. Free Fe(CN)
64− will exhibit three vibrational modes with
A1g at 2098 cm
−1 and
Eg at 2062 cm
−1 in the Raman spectrum, and
T1u at 2044 cm
−1 in the infrared spectrum. For the intercalated LDH, they detected bands in the Raman spectrum at 2136, 2094 and 2065 cm
−1 for hexacyanoferrate(II) intercalated LDH and at 2164, 2136, 2094 and 2059 cm
−1 for hexacyanferrate(III) intercalated LDH, clearly supporting the fact that a change in the site symmetry had taken place as well as partial reduction. Lowering the site symmetry to
C3 after intercalation in LDH would predict four bands in the Raman spectra for both the hexacyanoferrate (II) and hexacyanoferrate(III) anions, resulting in theoretically eight modes. In reality, it is expected that a number of these modes will overlap, causing the detection of fewer bands.
It is clear that the case of hexacyanoferrate(III) intercalation in LDH generally results in a partial reduction of Fe3+ to Fe2+. In contrast to the other anionic groups studied here, the reduction of hexacyanoferrate(III) results in clear changes in the infrared and Raman spectra. These changes are also clearly visible in the XPS Fe 2p spectra. Integration of the peak areas for both the Fe 2p3/2 of Fe(II) and Fe(III) allows for a direct measure of the amount of reduction. In this sample, 45% of the Fe(III) was reduced to Fe(II).